News Tidbits 4/26/19

27 04 2019

1. Here’s a little more information on the proposes medical office building at 2141 Dryden Road. Site Plan here, planning department memo here. A local doctor operating as “Slaterville Springs Real Estate Company, LLC” is planning a 3,676 SF pre-fabricated building on the site. The building would be built using a Superior Wall precast concrete foundation (Superior Walls are commonly seen with modular builds), and built into the hillside – one story from the front, two from the back. The doctor’s office would occupy the upper level, and the lower level is spec space. The plans include a roof-mounted solar system, electric heat pumps, and an electric vehicle charging station in one of the three proposed parking areas. 48 parking spaces are indicated, four of which are ADA compliant. A covered bicycle rack and dumpster enclosure are also provided.

Having all these green features at a semi-rural site with gobs of parking (the Institute for Traffic Engineers’ parking standards for medical offices is about 3.5 per 1,000 SF, or 13 in this case) is liking having a diet coke with your Big Mac. A project can be “green”, but much of its green impacts are mitigated if it encourages fossil fuel use with increased vehicle traffic. It would benefit the town to plan and zone for developments like this closer to villages and hamlets.

The site also includes landscaping, some limited signage, lighting and stormwater features. The town planning department’s opinion is that the project is not substantial enough to merit full site plan review. Spec Consulting of Groton is doing the project design.

2. The Black Diamond Trail will receive a major addition after New York State announced funding for a bridge over the Cayuga Lake flood control channel earlier this week. The $1.2 million award from the state will pay for the construction of a new pedestrian bridge for the trail, which will span the inlet from the current trail segment along Floral Avenue, to the intersection of Cherry Street and Cecil Malone Drive. This would provide greater connectivity for West Hill residents to the businesses along the waterfront and the big box corridor, giving them to option to walk/bike through here instead of going up to West State Street. In an interview with the Journal’s Tom Pudney, city transportation engineer Tim Logue notes that design work, public hearings and municipal approvals for the bridge will take another 18 months, so construction won’t be until 2021.

3. Now for a look at Dryden’s Mill Creek subdivision. Site plan application here, proposed covenants here, site plans here. This is the 908-acre subdivision of land west of Freeville into forty home lots. It looks like the Lucente family (as RPL Properties, for the late Rocco P. Lucente) is working with surveyor Alan Lord to plat the lots. The 40 lots range in size from just over 5 acres, to 60 acres. 23 acres on the eastern edge of the parcel would be deeded over to the town for land conservation.

Even as subdivisions go, this is a very questionable design because it’s not really following state guidelines for conservation subdivisions, which cluster houses near roads on smaller lots so as to preserve natural space. These lots aren’t designed for that, which really opens up the possibility of large-scale natural space degradation or destruction. Given that the zoning here is a conservation district, it meets the word of the law, but not the sentiment.

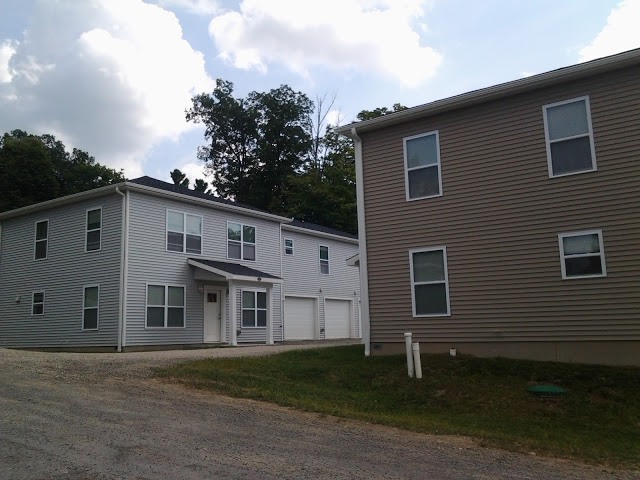
4. Courtesy of the County Clerk’s office, we now know what the amount of the construction loan was for the latest phase of the Village Solars. 24-unit Building “K” (113 Village Circle) and 24-unit Building “L” (40 Village Place) received a $5.6 million loan from Elmira Savings Bank, which is mildly interesting in that the previous building loans were from Tompkins Trust. Note that the buildings are switched around from the site plan above, so that middle building is “K” and the building to the east is “L”. Both buildings are expected to be completed by the end of September 2019. I

n February, my last visit, Building “K” was substantially finished from the outside, while Building “L” was just a foundation pad. However, the Lucentes in-house construction team have been building these for years and have the process down pat, so if they’re framing by now, they could certainly have “L” finished by the end of September.

5. The recent article regarding the U.S. Census Bureau estimates created quite a stir and a number of strong and/or concerned emails. Before anyone gets hung up on the numbers,realize that the census is all about estimating from an annual survey of about 2.1 million households nationwide, out of a little over 126 million. They’re reasonably comfortable with national figures, a little less so with states, and generally, they just hope to be close with counties, especially medium-sized one like Tompkins who are hard to sample but can still vary by several hundreds of people from year to year.

Now consider the statistics mentioned in the article. From 2010 to 2017, the area added 2,412 housing units, and from 2010 to 2018 it added about 6,000 jobs (1.4% annual growth). The colleges add 800 or so students in total. All signs point to steady, modest growth.

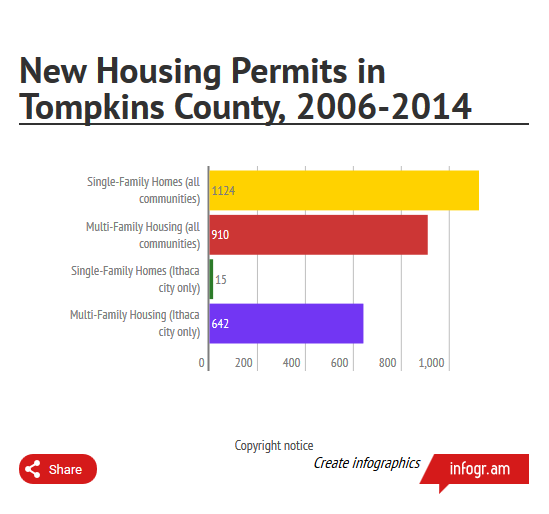
Here’s an exercise. Let’s take those 2,412 housing units. 964 single-family homes, and 1,448 multi-family units. The average household size is 2.5 persons/home, and 2.2/persons per multifamily unit. So a gross estimate for the number of occupants in new housing is (964 * 2.5) + (1,448 * 2.2), or 5,596 people.

Now for a couple of adjustments. Household sizes are known to be getting smaller. Nationally, from 2010 to 2018, the change was 2.59 to 2.53, so applying that same percent decrease to the single-family figure and the multi-family figure reduces the gross gain to 5,466 people. Also, let’s assume that not every housing unit permitted was built. The vast majority are, but not all. Let’s say 98% were. That reduces the figure to 5,356.

Secondly, some new housing replaces older housing. Those stats aren’t so readily available. But I track them here. In this case, the number I have on file is that of projects recently completed or proposed, net gain is 90.6% of the gross gain. That number is going to be a bit low because I don’t track single-family home construction, which typically happens on vacant lots. Still, assuming it’s otherwise an acceptable estimation, then (5,356 * .906) = 4,853 people.

Now, let’s account for vacancy. Overall, Tompkins County is ticking upward, though still below a healthy market rate / too tight in the urban areas. It was higher in 2010, lower in the middle of decade, and creeping up now as new construction is completed and occupied. Let’s say (rather optimistically or pessimistically, depending your view) there’s a one percent increase since 2010,. Tompkins had 43.453 housing units as of 2017. So with a +1% vacancy since 2010, that’s 434.5, of which 52.7% are homes if we break it up perfectly, but since rentals have a slightly higher vacancy rate in general, let’s say 50-50. So ((217.25 * 2.5) + (217.25 * 2.2) ) * (2.53/2.59) = 997 people.

Let’s do the math. 4,853 people – 997 people = 3,856 people. Add that to 101,564 reported in 2010, and you get 105,420 residents in 2017. The Census’s 2017 estimate for Tompkins County was 104,871. Extrapolate it out a bit, and assuming Tompkins continues to add at about 551 people/year, and 2020 will clock in around 107,073 people. 5.4% growth. A hair below national average, but well above most of upstate New York and the Northeast.

So with that exercise in mind, don’t worry about the Census estimates. They will be what they will be, whether 2,000 people magically disappear or not. They’re not looking to be great, they just hope to be kinda accurate until the next census rolls out in 2020.


News Tidbits 11/18/2017: Fears and Hopes for the Future

18 11 2017

1. Here’s an interesting sale – a 62.1 acre parcel on Troy Road sold for $380,000 on the 13th, less than half the original asking price. The buyer, “Troy Heights LLC”, is registered to the same address as Giora and Limor Fix, a semi-retired husband and wife couple who have acquired a number of rental properties around the area over the past decade, with 43 or so units worth something in the ballpark of several million dollars (units are marketed by the Fixes under the name “Homes-for-you Rental Properties”).

The Troy Road property is intriguing because there was a development proposal floated there a few years ago. Rural Housing Preservation Associates LLC had proposed a 130-unit combination of middle-market single family homes, townhouses and small apartment buildings for the site back in 2014; it started as 206 units, the town and neighbors complained it was too big, the project was whittled down to 130, and then the proposal was cancelled by September 2015. Using cluster zoning, the project could have built out 145 units in the low-density residential (LDR) zone, since the town’s cluster zoning allows 2.3 units/acre. STREAM was in charge of the project design, and some of the renders of the never-built apartments can be found here on their website.

So here is a log lot, bought by folks involved in local real estate and with significant assets, under the name “Troy Heights”, which sounds like a project title if anything. I reached out to Giora Fix, and he was kind enough to respond:

“[C]urrently we do not have any concrete plans to develop Troy Road. Once we have them I will be happy to share with you.”

So something to keep an eye on, though it might be a while.

2. Here’s a piece of news from the Times’ Nick Reynolds. With regards to the police consolidation debate, the city wants to have the headquarters downtown on Green Street (likely in that proposed centralized government facility floated for the Central Fire Station site), while the towns would prefer something near the current BPW on the north end of the Northside neighborhood, which offers easy access to Route 13. Consolidation is still a rather unlikely prospect at this time, and there’s little enthusiasm from the more rural parts of the county. But it sounds like the sheriff is keen on killing the city’s ideas before they take off.

3. Bad jobs month for the state, good for Ithaca. The Ithaca metro (Tompkins County) added 1,800 jobs (all private sector) from October 2016 to October 2017, bringing the total to 67,800. The 3.2% increase was the largest gain by percentage in the state over the time period. Unfortunately, the state as a whole lost 11,900 jobs last month, which falls even more to 14,600 jobs when taking away those added by the public sector (government jobs). A study from the Federal Reserve Bank last month notes that upstate economic growth in general has been losing steam over the past year, with exceptions for Ithaca and Albany. New York City is performing reasonably well.

While it’s well and good that Ithaca is doing well, I have concerns about the recent tax reform bill going through Congress. With the potential hit to SALT deductions and the taxation of graduate student tuition waivers, I could see significant negative impacts on the local economy. Given that most communities have property taxes in the range of $2500-$4000/$100,000, a cap of $10,000 as proposed by the House would hit many middle-class and upscale neighborhoods hard. A typical home in Ithaca city is worth about $230,000-$270,000 range at this point, and with about $3779 per $100,000 in property taxes, that means that homeowners with properties valued over $265,000 will take a financial hit, close to half of the homes sold. The Senate’s version removes the SALT deduction completely, affecting all local home buyers. Either case would be a severe blow to the home buying market.

Another concern is the taxation of graduate student tuition waivers as proposed by the House plan. Speaking from experience, I had a waiver that saved me about $14,000/year at the public university where I did my master’s. In my case, seeing that taxes would have cost an extra couple thousand in theory, though the doubling of the standard deduction might have limited its impact on me. A Cornell graduate student is looking at $20,800-$29,500, and could see a tax bill larger than any savings from the standard deduction increase. The Senate version does not tax tuition waivers. Another, lesser factor to consider is that the student loan interest deduction for borrowers on-time with their payments would be eliminated.

On a final note, Cornell’s endowment would be taxed an extra 1.4% under the House bill, as would any college whose endowment is worth more than $250,000 per full-time student. Cornell’s endowment is $6.8 billion, and the school has 23,016 students across all campuses as of Fall 2017. That is over the allowed cap of $5.75 billion as calculated by the bill’s guidelines.

The long story short is that Cornell recruitment takes a hit, as does its endowment, and that could impact current employment as well as future hiring. Politics aside, these “reform” bills are definitely a cause for concern from Ithaca and Tompkins’ economic standpoint.

4. A separate note not so much economic, but something many Ithacans care about – the House bill takes away the historic building rehabilitation tax credit. The renovation of 310 West State Street that I reported in the Voice earlier this week would be off the table without them, and the building will likely be demolished if the credits are eliminated. So the impacts aren’t just economic, but perhaps aesthetic as well.

5. This is looking to be a very quiet late November. For the first time in over a year, the town of Ithaca has cancelled two planning board meetings in a row. Meanwhile, in the city, the only “old business” reviews are final site plan approval for the 601 South Aurora duplex, and final approval for the Brindley Street Bridge replacement.

6. So technically, the Request for Proposals went out for the Green Street Garage site. A site tour for interested applicants is scheduled for December 4th, applications are due by January 23, 2018, and no timetable is given for the selection of the preferred developer. The applications are to include a cover letter, application form, description of project team members with relevant experience, proof of ability operate in NYS, good reputation, financial status, marketing plan, tenant management plan, conceptual designs, financing plan and demonstrated capacity to obtain financing, purchase price, project schedule, community impact benefits statement, schedule, and specific concerns (acknowledgement of site issues and plan to resolve them). A $500 application fee is also required.

Obviously, Ithaca Associates LLC has a huge leg up on the competition, since they not only have a plan fleshed out, they own the ground lease under the eastern end of the garage that everyone else would have to negotiate to obtain. About the only legitimate opening to another developer would be for the western and central portions of the garage, though the city’s requests make it such that anyone else interested had better be thinking big with housing, parking, and other site uses. Saying you’d leave things as-is would be an immediate disqualifier. Unless Fox or Lubin are dreaming up multi-story apartment buildings, it isn’t likely many developers will entertain this RFP. This really feels like it’s just the city stalling for time so they can fully absorb the immensity of the 365-unit, $118 million “Village on the Green” proposal.


The War in Fall Creek

22 09 2015

A few weeks ago in the Voice, an article ran saying that bidding wars were breaking out in Fall Creek. Homes in the neighborhood are being fought over by multiple buyers, and driving up the sales prices (and assessments for all the other properties).

So, being of an analytical mind, I wanted to see if there was any way to prove that. And that is the topic of today’s post.

So the hypothesis is, if there are bidding wars going on, we should be seeing relatively low reductions from listing to sales price, or even sale prices above the listing price. According to anecdotal evidence from real estate website Zillow, 90-95% of list value is common, assuming that the home was priced realistically for its market.

Using the bounds of Fall Creek as defined in the article, listing and sales data were pulled from houses sold within the neighborhood from 2013 to present. Zillow and Trulia (mostly Zillow) were used to find old listing prices, and the sales price were cross-checked with the county records website when possible. The initial price was used, meaning that if the owners reduced the price before a house sold, it “didn’t count”.

fall_crk_2

One of the problems is, not all houses go through real estate agents, and not all homes are widely advertised when they’re put on the market. There’s a lot more sale information out there than there is listing information. Nevertheless, sales and listing prices were found for 45 homes in the Fall Creek area. Not the most robust sample size, but the homes are a nice distribution of sub-neighborhoods and sales values. The mean listing price here is $238,460, and the median $226,900. The average home value in Ithaca was about $220,500 over that time period (and $229,100 now), so our initial values are both pretty close to the city average.

fall_crk_3

Now let’s look at the sale prices. Many prices went down, and judging from the increase in a few of the pricier bins, some values went up as well. The mean sales price is $234,444, and the median sales price is $225,000. The lump sum math says that the average decrease from listing to sales price was 1.68%. So if we go by the Zillow guideline of where sales price is 90-96% of listing price, and here the sales price is 98.32% of the list price, then there’s at least evidence that Fall Creek is doing quite well as a real estate market.

fall_crk_4

However, looking at the aggregate values don’t tell the whole story. Breaking down and sorting the percentage change between listing price and sales price, 17 of the listings saw an increase from the asking price in the listing, to the sales price. And then there’s at least 4 property owners who either had really unrealistic expectations, or were hosed. One of those houses was on the market for 22 months, while most of the other listings were on the market for 2-4 months (and by on the market, I’m counting the pending sale/listing removed period).

fall_crk_5

If one goes looking for trends with time, they won’t find anything here. With an R-squared of 0.0447 (and R of 0.2114), the trend line is crap and there’s no strong correlation with prices as a function of time. There didn’t appear to be a strong trend geographically either, although I did not set up the data for geographic parameters (but if someone really pushes for it, it’ll be produced for verification’s sake).

In conclusion, there might be some bidding wars going on. There are definitely homes selling over asking price, and the housing market in Fall Creek is certainly healthy. But there are still a number of homes selling in the more typical -5% to -10% range, either because sellers are asking too much, or because buyers haven’t been biting (given the other evidence, I’m going with sellers asking too much).

There have been very rapid appreciations in home values in the past 15 years, which have caused strains for residents with modest or fixed incomes. But for now, home buyers appear more than happy to offer a way out. For better or worse.


News Tidbits 9/19/15: It’s A Numbers Game

19 09 2015

tc_housing_permits_1984_2014

tc_housing_permits_pies_19904_20104

1. Readers might have noticed that there was no Monday night (Tuesday) piece this week. The piece that was originally scheduled evolved into the building permits analysis that was a featured article on the Voice (link here). The initial intent was to run a mirror of the piece on the same day, but things got a little delayed, and eventually I just scrapped running it as the topic-of-the-week.

The reaction was generally favorable (if maybe less traffic than hoped; math-y pieces typically aren’t big traffic generators), but there’s a couple of quick criticisms that came in that I want to address. Namely that I didn’t include proposed projects, and that I left out non-residential construction.

Truthfully, there is no reliable long-term record of non-residential construction. HUD doesn’t break it down in their SOCDS database, and the county doesn’t have complete data on non-residential construction (for their reports, they also rely on the HUD SOCDS database). Related to that, HUD data for 2015 is very preliminary, relying on imputed values. Finalized and corrected 2015 data won’t be available for use until March 2016.

That being said, residential permits are an effective gauge for a few reasons – one, residential is the largest individual construction sector nationwide; two most recent local construction is residential or institutional, and three, many of the projects built in Ithaca are “mixed-use” meaning they have commercial and residential components. although the commercial components aren’t kept in track, the residential construction permits are available, and are showing up in the city’s SOCDS data.

For proposed projects, it’s not prudent to “count your chickens before they’ve hatched”. This passage was originally in the piece, but was pulled before the final version was published:

“As mentioned earlier, news sources like us here the Voice are guilty are promoting the misconceptions. We try and keep tabs on all the big projects – when they get proposed, approved and underway. The thing is, not all projects go from proposed to built. Some never receive approvals. Some get approved, but wait years to get construction financing, if ever. So it seems like there’s more than there is.”

Without having hard evidence in front of me, I’d argue that if one were to somehow include office and retail, the area still isn’t booming if we’re looking in a historical timeframe – you’d have large spikes in retail during the mid 1970s when the mall was built, and from about 1997-2004 in Southwest Ithaca and Lansing for big box retail. For office space, there would be a peak in the late 1980s/early 1990s for the Cornell business park by the airport; there’s circumstantial evidence that the office market today is pretty weak, TFC’s HQ being the odd project out. Industrial space would have peaked with Borgwarner’s construction in the early 1980s, but in recent years it’s been minimal or even negative growth (due to the Emerson shutdown). Hotels might be the only category that shows a “boom” at present.

The point of the article remains that

1. If we look at available building permit data, Tompkins has seen an uptick in construction, but not a construction “boom”, and
2. It feels like a boom because the region’s coming off of a very low period of activity, and there’s more construction in the highly visible urban areas of Ithaca city, vs. the suburban and rural development that has been more prevalent in previous years.

20150829_121852 20150829_121855

2. It’s time for a semi-regular house-of-the-week feature. I’ve been meaning to update on this for a while, but I keep missing the turn off Route 79. Local developer Chris Petrillose of Petrillose Properties (possibly related to Bob Petrillose, the founder of the Hot Truck) recently finished his second and third duplex  off of Wiedmeier Court in the town of Ithaca. Like the first duplex that was finished last year, each building consists of a 4-bedroom unit and 2-bedroom unit.

According to county records, the Wiedmeiers began to develop the land in the mid-2000s, building 2 duplexes of their own before deciding to sell the other lots (Petrillose bought the lots for the duplexes in 2012). The rest of the land, 12.34 acres, is currently for sale, so perhaps this won’t be the last visit.

3. Previously reported here and on the Voice, the city is studying whether or not to sell fire station No. 9, located in the heart of Collegetown at 309 College Avenue, to an interested private developer. We now know the consultant the city hired to perform the study.

Kingsbury Architecture, a small local firm, is investigating whether it would be worth the city’s investment to build a new station elsewhere on East Hill and sell the aging station, or invest in repairs and long-term maintenance for the current 1968 structure. Kingsbury has little presence online, but in an example of how small of a world this is, they were the initial firm used to plan St. Catherine of Siena’s new parish center, the project discussed in last week’s news update. However, according to church newsletter, the congregation amicably ended the partnership because of cost issues. The church staff went architect shopping, and that’s how Richard McElhiney Architects came into the project. Some of Kingsbury’s work can be found on the church’s webpage here. Kingsbury also appears to have done some interior renovation work at Cornell, and roof replacement at the Cascadilla Boathouse.

state_st_triangle_v5_1

4. New documents from Campus Advantage give insights on the tenant mix and parking situation in downtown Ithaca.

First, my personal disclaimer – Even though part of their market research cites work I’ve written for the Voice about the housing crisis, my work was done impartially.

The new information comes as part of Campus Advantage’s official response to the city planning board’s request for more specific values on resident population, parking utilization and bus capacity, among other details. The documents are provided as part of the planning board’s materials here.

Updated figures indicate the proposed building has gone on a diet – the number of bedrooms has dropped from 620 to 582, the number of units from 240 to 232, and the square footage from 288,845 SF to 216,434 SF, a 25% reduction in mass. The maximum height remains the same at 11 stories at 116 feet. The slimming down comes in response to unfavorable review of the previous design as “too massive”, especially on the side facing East State Street.

sst_stats_1

According to an internal study by Campus Advantage, the Texas developer forecasts that, of the 582 tenants when at full capacity, 77.8% (431) will be students, and 22.2% (123) non-students. Of those students, 78.4% (338) will be undergraduates. Cornell students would comprise 64% (276) of the student population, Ithaca College 32% (138), and TC3 4% (17). A quick glance at the details behind these projections shows that CA assumes 95% occupancy, studios and other smaller units will be half or majority non-student, and that undergrads will be more inclined towards shared 4-bedrooms and 5-bedroom units. CA conducted online surveys with student groups to gather information for their study.

sst_stats_2

The parking demand from residents is predicted to be 191-219 spaces, taken from a study conducted by third-party traffic engineering firm SRF Associates. A further 64 parking spaces will be required for commercial retail tenants on the first floor (57 customer spaces, 7 employee spaces), for a grand total of 283 parking spaces. The 2012 Randall/West Collegetown parking study used as reference looked at student and non-student vehicle ownership in the Collegetown neighborhood, and the higher end (or “more conservative”, as SRF calls it) 219-space figure comes from a calculation the Urban Land Institute, a non-profit urban planning think-tank. Given that Randall/west focused on Collegetown, the more conservative figure is the safer bet.

It’s not clear whether the parking garage study above is CA’s or the city’s, but the application itself states that the city’s Parking Director, Frank Nagy, has confirmed that enough parking is available, and a letter from TCAT’s Doug Swarts states that TCAT has the capacity for State Street Triangle’s potential tenants. Looking at the above study, though, it appears that if built, and if all the other approved and likely projects (i.e. don’t include 130 East Clinton) are built, the parking garages will be nearly full.

Since the new drawings were presented at the public open house on September 10th, there do not appear to have been revisions – what was shown then will be shown at the planning board meeting next Tuesday (links to those drawings here). However, the planning board will be looking to schedule a design review committee meeting, where board members provide suggestions and guidance on design features for the new building. In other words, this probably isn’t the building’s final design.

Also included in the attachment are two opposition letters – one from Historic Ithaca saying the building’s still too tall and massive, the other from former planning board and councilwoman Jane Marcham, who takes the unusual if debatable tact by saying that students living downtown deprives the colleges of campus life. Students comprise 40% of the market-rate downtown rental market, so there’s a few to interview for opinions should anyone be interested.

As always, the project is likely to inspire some debate at the planning board meeting. We’ll see if the changes are to the board’s liking.

815_s_aurora_1

5. Wrapping up this short but informative week, here’s a look at the Planning Board agenda for next week:

A. State Street Triangle – Public Hearing, City Environmental Quality Review (CEQR) discussion, and scheduling a Design Review Committee meeting. CEQR is they city’s more in-depth take on SEQR, where a project’s environmental impacts are considered, and a negative declaration (acceptance) is given only when adverse factors have been mitigated in a way the board sees fit. Design Review Committee pretty much is as it sounds – the board makes suggestions on the building design as a quality control / quality assurance measure.

B. 215-221 Spencer Street, Determination of Environmental Significance and Recommendation to the BZA – the board has decided to recommend approval of the parking variance (parking within the rear yard setback), given the site’s steep topography.

C. Site improvements, 416-418 East State Street416-418 East State Street is currently home to an underused 7,600 SF office and a connected manufacturing/storage building. The house dates from the 19th century, with various additions as recent as the 1970s. According to plans filed with the city, an LLC linked to Argos Inn architect Ben Rosenblum has plans to convert the old manufacturing space into a bar and storage space, with renovated offices and a 2 bedroom apartment in the original house. The project will include an accessory parking lot, revised landscaping and handicap access. Area and setback deficiencies have resulted in the need for a zoning variance, but a parking variance won’t be required because the bar will have after hours parking across the street at Gateway Plaza. The building itself won’t change dimensions, but the change in use triggers the city zoning laws.

There have been substantial concerns expressed about this project – neighbors are vociferously opposed to a bar, citing noise problems and concerns about smokers, and the county planning department is not a fan of the traffic and parking arrangement. The city will need to examine this project carefully.

Scott Whitham is serving as a consultant, and local architect Jason Demarest is designing the renovation.

D. Hotel Ithaca – Amended declaration of environmental significance. Backstory and plans here.

E. “Sketch Plan – 815 South Aurora Street, 87 unit housing project” – See conceptual design above, full backstory here. To recapitulate the salient details, local developer Todd Fox of Modern Living Rentals would like to build apartments on vacant land at 815 South Aurora Street, but can’t because the vast majority of the property is within the “fall zone” of a cell tower, which the city defines as twice the height of the tower. The 170′ tower creates a 340′ radius of no-man’s land (outer circle above), making the parcel virtually undevelopable. Fox had two private engineering companies (TAITEM Engineering and Spec Consulting) analyze the case, and they determined that an appropriate fall zone is the height of the tower plus 10 feet for a little wind/bounce – so 180′ total. With this info in hand, Fox tried to get the city to refine the zoning to allow the decrease in fall zone and therefore permit the land to be open for development. But when Fox and project architect Noah Demarest approached the BZA, they said they wouldn’t consider the 815 South Aurora Street application unless the law was amended, or Fox and Demarest go through the sketch plan and review process, and submit a formal application for a zoning variance.  So now we’re at the point of having a sketch plan to present. Regardless of design, the project will need an area variance issued by the BZA for the cell phone tower issue. At 87 units, this will be a pretty sizable project, and given Fox’s previous work (he’s been rather busy lately), it will likely be rentals, perhaps with Ithaca College students as the target market.

3 of the 5 projects above (SST, 215-221 West Spencer, and 815 South Aurora) have Noah Demarest/STREAM Collaborative as a lead or consulting architect. None of them have the same developer. Talk about having your fingers in many pots.


“Fun Facts” About the Ithaca Workforce

21 07 2015

100_1471

A few weeks ago, I did an article for the Ithaca Voice about how wages in Ithaca are only slightly higher than peer communities in upstate, yet they pay a lot more in rent.

This article isn’t going to focus on that, although I could certainly add a few more pages (or at least fix the embedded graphs issue in the first article). This “topic of the week” piece is intended to be more of a “fun facts” about the Ithaca labor market.

The data comes from the Department of Labor here. All figures date from May 2014.

– The major category that employs the most people in Ithaca is no surprise – “Education, Training and Library Occupations”, with 15.49% of the jobs in the Ithaca metro (the BLS estimates this category to have 7,660 jobs locally, but that would suggest only about 49,430 jobs in the region when their numbers elsewhere say 70,000…make of it what you will). This turns out to be the highest percentage for any metro in the entire country.

This category, which includes professors, teachers, librarians and teaching assistants, averages pay of $80,700/year locally, versus $46,660/year nationally. Not only is Ithaca the metro with the largest percentage of educators and librarians, it’s also the one with the highest wages – Ann Arbor (U. of Michigan) comes in second with $79,500. Ithaca’s quintessential college town vibe is strong.

– The occupational category with the highest average pay is no shocker either – Physicians and surgeons, who employ about 80 people locally and average a pay of just over $233,000/year. The national average is only a little lower at $224,000/year. They are followed by the 40 or so dentists in the region making an average of $205,000/year (national average $167,000/year).
– On the other end of the scale, fast food cooks make the least – the 140 estimated by the BLS make about $18,680 per year. Food prep, delivery drivers and laundry workers all make less than $20,000/year on average, and amount to 1,380 workers. The median salary for all jobs in the Ithaca area is $52,020/year.

– Some other rankings where Ithaca comes in the top 10 of the nation’s 381 metros: professional chefs (8th highest concentration in the nation), microbiologists (7th highest concentration), psychologists (5th) and editors (4th – here’s looking at you, Jeff).

– Now here’s a fun category – location quotient. Basically, how many times more likely a certain type of worker is in a given area versus the national average. For example, my field, atmospheric and space scientists, has a location quotient of 107.36 for the Boulder, Colorado – in other words, atmospheric and space scientists are 107.36 times more common  in Boulder than the national average. This is why we have a joke in my field that Boulder is like Mecca for atmospheric scientists – you have to visit at least once before you die, otherwise you can’t go to Heaven.

So what fields have the highest location quotients in Ithaca? Economics professors (24.53), Physics professors (14,49) and Fundraisers (14.03). And yes, Ithaca has the highest concentration of people in those fields out of any metro area in the country. Now I know why Cornell is so persistent with its donation solicitations.


The Case For More Housing

7 07 2015

Last week, Ithaca mayor Svante Myrick and county Legislator Martha Robertson issued an opinion piece on the need for more housing, and especially affordable housing, in the city and county. There were two, fairly simple reactions to the article – readers believed it and agreed there was a housing issue, or they thought it was bunch of lies.

Being a data-driven person, I decided to delve a little deeper into the numbers behind Myrick and Robertson’s claims.

Let’s start with the 2006 housing study that was cited in the article. According to that study, performed by Vermont-based Economic & Policy Resources Inc. (EPR), 2,127 rental units and 1,767 owner-occupied units would be needed by the end of 2014, for a total of 3,894. These numbers were determined using the 2005 housing deficit (871 units), economic trends and population/demographic trends.  Some readers may remember the quote of “4,000 units of housing” cited in news pieces back in the mid-2000s, and this is where it comes from.

permits_tc_2006_2014

Using data from the U.S. Housing and Urban Development’s State Of the Cities Systems (SOCDS) Database, new housing permits were pulled for the same time period as the study’s projection, 2006 to 2014. From 2006 to 2014, Tompkins County added 1,124 single-family homes and 910 multi-family housing units (apartments and maybe a few co-ops or condos), for a total of 2,034 housing units. In what is a surprise to no one, the majority of multi-family housing was built in the city of Ithaca, and the majority of single-family homes were built in surrounding towns. The county had 40,069 housing units in 2006, so in that nine-year span there was about 5.1% growth in housing units, to 42,103.

The EPR study stated that 3,894 housing units would be required. With 2,034 units actually built, that means only 52% of the housing needs identified by the study were met. Breaking it down further, homeowners, occupying mostly single-family properties, fared a little better – with 1,124 built of the 1,767, that meant 63.6% of the homes that were needed based on 2006-2014 projection were built. However, for rental units, which are mostly multi-family housing, it was only 910 of the 2,127 needed – 42.8%. Not even half.

This wouldn’t be a problem if the economy slowed down or population growth leveled off, but neither of those occurred. Even with the recession a few years ago, job totals have increased quite a bit, with over 6,000 jobs have been added to the county since 2006. The population has also increased – Tompkins County had 99,997 residents in 2006, and in 2014 it was estimated to be 104,691. Rather oddly, the county added 3,049 housing units from 1997-2005, the previous nine-year period, but only 3,482 residents. Population growth has climbed even as housing construction has dropped.

Perhaps most importantly, the 2006 EPR study never accounted for changes in student population. It assumed net zero change for the purpose of the study, which focused on permanent residents. Unfortunately for the housing situation, there’s been a huge growth in student population. Cornell added 2,040 students from 2006 to 2014. Ithaca College added a more manageable 178 students. According to the U.S. Census Bureau, the average rental unit in Tompkins County houses 2.14 people. The county’s staring down 1,036 units it didn’t plan for, and as noted in the opinion article, Cornell plans on increasing its enrollment further.

For the record, IC has added student housing in the period from 2006 to 2014 – an addition to the Circle Apartments south of campus, which opened in 2012 and increased campus housing capacity by 138 beds. While South Hill students are driving up housing demand, the overall impact is minor.

In contrast, when Cornell rebuilt its West Campus Housing during the 2006-2014 time period, there was no net increase in the total number of beds. The Big Red has had no gain in student housing since new dorms opened on North Campus in 2001. With the impending closure of the 480-bed Maplewood Park student housing complex, the situation may get worse. No one can force Cornell to build new housing, but their burgeoning student population does add a substantial strain to the market.

housing need_tc

Given the numbers above, Tompkins County fell 1,860 units short of its 2014 housing goal; add in the unexpected influx of college students, and the number rises to 2,832. It wasn’t good to have some affordability problems when the county was 871 units short of a balanced market in 2005; at the 2014 deficit of 2,832 units, the impacts become much more severe, which is why housing affordability has become such a big issue.

Myrick and Robertson’s column might be an opinion, but the statistics give their opinion a lot of weight.


Fast Facts: Ithaca College Employee Headcounts

12 05 2015

All facts come from Ithaca College’s Office of Institutional Research. All enrollment values are for the fall semester of a given year, i.e. 2001 means fall 2001.

Since the blog has previously taken a look at Cornell’s faculty and staff headcounts, it seems only fair to take a look at Ithaca College’s as well.

ic_headcount_1

Over the past decade or so, Ithaca College’s employment has grown. Since 2002, headcount has increased by 302 people/20.1%, about 1.68% per year on average. During the recession, employment at the school actually increased at a faster pace than the average, a stark contrast to the hundreds of jobs that were cut at Cornell.

ic_headcount_2

Breaking the numbers down into faculty and admin/staff components, faculty employment has grown by 155/26.96% since 2002, somewhat faster than the 147 person/15.86% growth in staff employment.

For the sake of comparison, Cornell employed 7,075 non-academic staff in 2002 and 7,018 in 2014, a 57 person/0.8% decrease. The Big Red also employed 2,756 faculty/academic staff in 2002, and 2,763 profs and lecturers in 2014, a 7 person/0.3% increase. (note, Cornell numbers are for the Ithaca campus only).

In other words, we have over the past decade or so, one school that has seen only small enrollment growth but large employment growth, while the other has seen large enrollment growth and no employment growth. I can’t vouch for whether one school’s grasp of their situation is better than the other, but the differences between the two make for an engaging conversation piece.

ic_headcount_3

Here’s something more apropos to current events – the split between full-time and part-time faculty at IC. In 2002, 18.41% of male faculty and 26.92% of female faculty were part-time. In 2014, 28.42% of male faculty and 33.71% of female faculty were part-time. Although Ithaca College has added 155 faculty over 12 years, only 57 of those positions are full-time. Part of the the growth in part-time faculty can be attributed to the growth in graduate students, who are considered part-time faculty at IC if they are teaching. But regardless, it’s clear that Ithaca has become more reliant on part-time staff to meet its teaching needs.

Not to take an official stance on any union-organizing, but double-checking with some previous Voice write-ups, the graph above means that there were 226 Ithaca College faculty that were earning no more than about $16,000/year.

Cornell doesn’t have part-time faculty listed in their data, but I assume grad students with TA assignments fill that role. As of 2014, 6.6% of non-academic staff at Cornell (468 of 7047) are considered part time, while 25% of non-academic IC staff (268 of 1074) are part time. So maybe that’s another piece in the conversation comparing schools.


Fast Facts: Ithaca College Enrollment Figures

5 05 2015

All facts come from Ithaca College’s Office of Institutional Research. All enrollment values are for the fall semester of a given year, i.e. 2001 means fall 2001.

I give what’s probably an unfair amount of attention to Cornell. Part of it is because that’s the campus I know. But Ithaca College has its impacts and influences on the local community as well. Today will take a look at Ithaca College’s enrollment over the years.

ic_enrollment_1

One thing that is clear looking at Ithaca College’s recent enrollment totals is that on the whole, there has only been a modest increase in enrollment in recent years. Enrollment was fairly flat during most of the 2000s, grew a few hundred students during the Great Recession, and has been dropping in recent years. You put a best fit line on this and you get a best-fit line of the equation (student population = 30.374(years out from 2001)+ 6368.5). But the best-fit line is by no means a good predictor in this case.

IC strives to be all residential college, and these fluxes have put a strain on its resources and ability to “run lean”. The college offered students $1500 incentives to live off-campus during fall 2005, as they were forced to convert lounges into dorms. The skyrocketing enrollment in 2009 forced the college to construct a temporary dorm at a cost of $2.5 million, and even offer a few incoming freshmen $10,000 to defer matriculation.

As a general observation of Ithaca’s housing issues, the spotlight can be shined directly on Cornell, whose enrollment has increased by nearly 2500 students since 2005. There hasn’t been much private housing built for IC students in recent years (perhaps a few dozen units), and barring the occasional over-enrolled year, there hasn’t been as much need for private student housing on South Hill.

ic_enrollment_2

Recent trends noted, historically Ithaca College has grown by leaps and bounds. Apart from a small drop in enrollment when the school was moving into its new South Hill digs in the early 1960s, enrollment continued to swell all the up to about 1991. when it enrolled 6,443 students. Enrollment fell 12% to 5,688 in 1994, before slowly rising back up in the late 1990s and early 2000s.

ic_enrollment_3

Looking at graduate student enrollment, there was a substantial increase during the 2000s, climbing from 230 in 2004 to 507 in 2010. Since then, however, the number of grad students enrolled on South Hill has tapered down to 463.

ic_enrollment_4

One thing that has stayed fairly consistent over the past decade is the proportion of gender on the Ithaca College campus. The gender split is typically 42-44% male, 56-58% female, with this year having the highest female proportion in recent years, just like Cornell.


Fast Facts: Cornell Enrollment Figures, Part II

31 03 2015

Part I in September 2013 looked at enrollment from 2002-2012. This time, it’s a look over the whole 150 year history of Cornell.

The information and plots included here come courtesy of the Institutional Research and Planning unit at Cornell University, the same unit that maintains the Cornell University Factbook.

cornell_enrollment_1

As of Fall 2014, Cornell University enrolled 21,850 students at its Ithaca campus, the latest statistic on the rapid increase in student population since 2005, when the total student population was 19,447.  Many of the ups and downs in the 150 years or Cornell are easy enough to qualify – drops in male enrollment as students went off to fight in World War I and World War II, the Post-WWII GI Bill bringing an enormous increase in enrollment. Then there’s a leveling off in enrollment during the 1970s due to financial constraints, and the rapid rise of women in college starting in the late 1960s, as more and more women sought out education and careers.

Early on, a decline can be seen in enrollment, from 561 in 1876-77 to a low of 384 students in 1881-82. According to Morris Bishop in A History of Cornell, “Various reasons were given for the dwindling enrollment: hard times, increased tuition, stiffened entrance exams, coeducation, Cornell’s reputation for religion. Probably each of these reasons was valid in certain cases (p. 201).” The absence of university president A. D. White while he served as the U.S. Ambassador to Germany from 1879-1881 didn’t help matters. Thankfully for the university’s finances, enrollment rebound and morale increased after White returned.

cornell_enrollment_2_ug

More notably, starting around fall 2011, the number of women enrolled as undergrads exceeded the number of men, the first time ever in Cornell’s history. This reflects national trends – women are now the majority of matriculated students in all self-identifying groups.

cornell_enrollment_3_grad

Perhaps in part due to large increases in research spending in the 1950s and 1960s, grad students more than doubled in population in fifteen years, increasing from 1,528 in 1950 to 3,149 in 1965. The growth since 2000 isn’t as dramatic, but nearly as large in number – 3,918 in 2000 to 5,140 in 2014. The drop off in the 1990s can be attributed to “cuts in federal aid to higher education, especially R1 type institutions”, according to Ithaca College Economics professor Elia Kacapyr.

cornell_enrollment_4_law

Taking a quick look at the law school’s enrollment numbers, there was a tremendous spike in enrollment after World War II, thanks to the GI Bill – 460 students in 1950, more than doubling the 201 reported in 1939. 78 percent of law students in 1950 hailed from other institutions for their undergraduate degrees (Morris Bishop’s A History of Cornell, p. 575). During WWII, the law school accelerated its degree program by a year (Bishop 547), which might explain why the drop was more severe than in other programs. A mere 49 students were enrolled in the law school in Fall 1943.

More recently, Cornell had a spike in law school enrollment, as part of a larger boom in law school education during the recession. The law school went from 583 students in 2008 to 689 in 2009, a remarkable amount of growth for one year. Law school looked like a ticket to a six-figure job during the recession, but after a couple of years of horror stories of law students unable to find high-paying jobs to match their high debts, applications have decreased nationwide and the enrollment numbers at Cornell have eased down just a little bit, to 668. The shrinkdown isn’t nearly as bad as some other schools, however.

cornell_enrollment_5_mba

On the other hand, it now seems like MBAs are the go-to for that six-figure job, with a large boost in matriculants nationwide. Whether or not B-school grads have a law school-like meltdown has yet to be seen, but there’s no doubt that MBA student enrollment is growing by tremendous leaps and bounds Far Above Cayuga – the Johnson School of Management has grown from 655 students in 2004 to 1,168 in 2014.

One thing that stands out is that from 1947 (when the business school began teaching students) to 1969, there had never been more than 4 women enrolled at any one time.

cornell_enrollment_6_dvm

Lastly, the Vet School. Morris Bishop has an enlightening anecdote to share about applying to the school in the Post-War era:

“The Veterinary College was distressed by its popularity. The upsurge of interest in the scientific study of animal life and disease overwhelmed the country’s ten veterinary colleges. By 1947 we had 750 applications for entrance, or fifteen for every place. Since our first duty was to New York State boys, out-of-state applicants had one chance in forty of admission. The same situation prevailed elsewhere; a boy who lived in a state without a veterinary school had practically no chance of entering the field. The need led to the creation of a number of new schools, and the pressure upon Cornell gradually eased.” (Bishop 576)

Starting in 1980, women exceeded enrollment of men at the Vet School – today, the breakdown is about 75-25 in favor of women. I have had several vet school friends say that to be a single straight male in the Vet School makes one a very hot commodity. Cornell can expect to see increases in enrollment in the next few years, as part of its plan to enroll 120 in each class (480 total, up from the current 421) by 2017.


2013 Census Estimates, Part II: Everybody Shares the Wealth

24 05 2014

5-1-2012 136

For the data geeks out there…the 2013 census estimates. A few highlights:

  • No city, village or town in Tompkins County is estimated to have lost population from 2012-2013, or 2010-2013.
  • Ithaca city had an estimated gain of +180 since 2012. The current estimated population is 30,515, 1.67% higher than the 2010 census value of 30,014.
  • Ithaca city is growing faster than Ithaca town, but the pace is uneven. Ithaca town was thought to have lost population from 2010-2011, but gained a greater percentage than Ithaca city this past year.
  • The village of Dryden exploded 8.7% in the past year alone, thanks to the opening of Poet’s Landing. For the decade so far, it’s increased 10.16% to 2,082.
  • More realistically, the second fastest grower is the town of Danby, from 3329 to 3462, or 4% in three years. Decadal extrapolation estimates 13.32% over the period (pop. ~3772 in 2020)
  • The slowest growing community is Freeville, with 0.77% growth from 2010-2013 (520 to 524). Second slowest is the town of Caroline at 0.94% (3282 to 3313). The county average is 2.02% for 2010-2013.

Entity 2010 REAL / 2010 EST / 2011 EST / 2012 EST / 2013 EST / GAIN, 2010-2013 /  DECADAL EXTRAP.

Tompkins County New York 101564 101588 101847 102713 103617 2053 2.02% 6.74%

Cayuga Heights village New York 3729 3729 3733 3756 3776 47 1.26% 4.20%

Dryden village New York 1890 1891 1897 1916 2082 192 10.16% 33.86%

Freeville village New York 520 520 520 523 524 4 0.77% 2.56%

Groton village New York 2363 2369 2371 2389 2408 45 1.90% 6.35%

Ithaca city New York 30014 30014 30167 30335 30515 501 1.67% 5.56%

Lansing village New York 3529 3529 3555 3597 3616 87 2.47% 8.22%

Trumansburg village New York 1797 1797 1809 1819 1832 35 1.95% 6.49%

Balance of Tompkins County New York 57722 57739 57795 58378 58864 1142 1.98% 6.59%

Caroline town New York 3282 3288 3280 3302 3313 31 0.94% 3.15%

Danby town New York 3329 3330 3364 3424 3462 133 4.00% 13.32%

Dryden town New York 14435 14436 14477 14617 14852 417 2.89% 9.63%

Dryden village New York 1890 1891 1897 1916 2082 192 10.16% 33.86%

Freeville village New York 520 520 520 523 524 4 0.77% 2.56%

Balance of Dryden town New York 12025 12025 12060 12178 12246 221 1.84% 6.13%

Enfield town New York 3512 3512 3534 3572 3586 74 2.11% 7.02%

Groton town New York 5950 5973 5985 6027 6091 141 2.37% 7.90%

Groton village New York 2363 2369 2371 2389 2408 45 1.90% 6.35%

Balance of Groton town New York 3587 3604 3614 3638 3683 96 2.68% 8.92%

Ithaca city New York 30014 30014 30167 30335 30515 501 1.67% 5.56%

Ithaca town New York 19930 19930 19836 19958 20132 202 1.01% 3.38%

Cayuga Heights village New York 3729 3729 3733 3756 3776 47 1.26% 4.20%

Balance of Ithaca town New York 16201 16201 16103 16202 16356 155 0.96% 3.19%

Lansing town New York 11033 11027 11082 11256 11362 329 2.98% 9.94%

Lansing village New York 3529 3529 3555 3597 3616 87 2.47% 8.22%

Balance of Lansing town New York 7504 7498 7527 7659 7746 242 3.22% 10.75%

Newfield town New York 5179 5178 5193 5235 5263 84 1.62% 5.41%

Ulysses town New York 4900 4900 4929 4987 5041 141 2.88% 9.59%

Trumansburg village New York 1797 1797 1809 1819 1832 35 1.95% 6.49%