Just Passing Through

28 09 2013

9-24-2013 066

So I made the annual pilgrimage back to Ithaca and Cornell for Homecoming. I’d love to say something about how I go back to reminisce about the quality education and think fondly of the many opportunities provides.

But I don’t. I could care less about football, and that plastic wine-glass thing that gave out as a Homecoming gift struck me as so unnecessary in my own home (where we be all fancy and use real glass) that I never even bothered checking in. I went back to see some old faces and attend my fraternity’s annual meeting, where I like to give uncomfortable glances whenever I hear/read things that are disconcerting, like steep increases in expenses, or membership decline, or things in those vein. Since none of their current membership were students while I was, I am able to get away with being a 24-year old curmudgeon. I also had a chance to see a pair of friends (one works at IC, the other is a Cornell PhD student), do acts of young alumni drunkery, and go to the Cornell Orchards for the first time ever.

Since I kept busy, I kept noticing things that I would otherwise hold off on commenting on. Like when I was doing a 4-mile morning run with my best friend, who is a Cornell employee, and we went past the Vine Street Cottages (I did not see any new homes in construction from the trail-side, but I am hopeful they’ve sold another lot or two). I could’ve went running with a camera. Could’ve cancelled lunch plans or dinner plans. But I didn’t. I know Ithaca Builds has a pretty firm grasp on these things. I passed a random house under construction near Honness Lane, and another later in the day on Hanshaw, near Freese Road. As my day went on, I kept taking mental notes, driving past the Goldwin Smith site work, Gates Hall, Seneca Way, Collegetown Terrace, into the city and past Breckenridge Place, and in an attempt to find parking for a West End restaurant, ended up seeing the structural framework going up for the new Planned Parenthood building. For better or worse, this is how my mind is wired. Two of my friends asked if I knew anything about Collegetown Terrace, and I was able to rattle off enough “fast facts” in twenty seconds that they commented that they were surprised and impressed.

It occurred to me in previous years, I would’ve been busting my hump trying to find time to dig out my camera and do a photo tour. But this year was different. I took it easy, I knew I had my stories, and Ithaca Builds has theirs, and they complement each other well. So I could take a deep breath. I could enjoy the extra time. I spent the afternoon before I left not running around like a man on a mission, camera in hand, but at my old fraternity, gathered around the open-porch lounge with about 15 of my contemporaries, some of whom I hadn’t really had a chance to talk to in ages.

It’s odd to say I don’t regret not coming back with a metric ton of photos, but this time around, I feel like my trip back was more fulfilling without them.

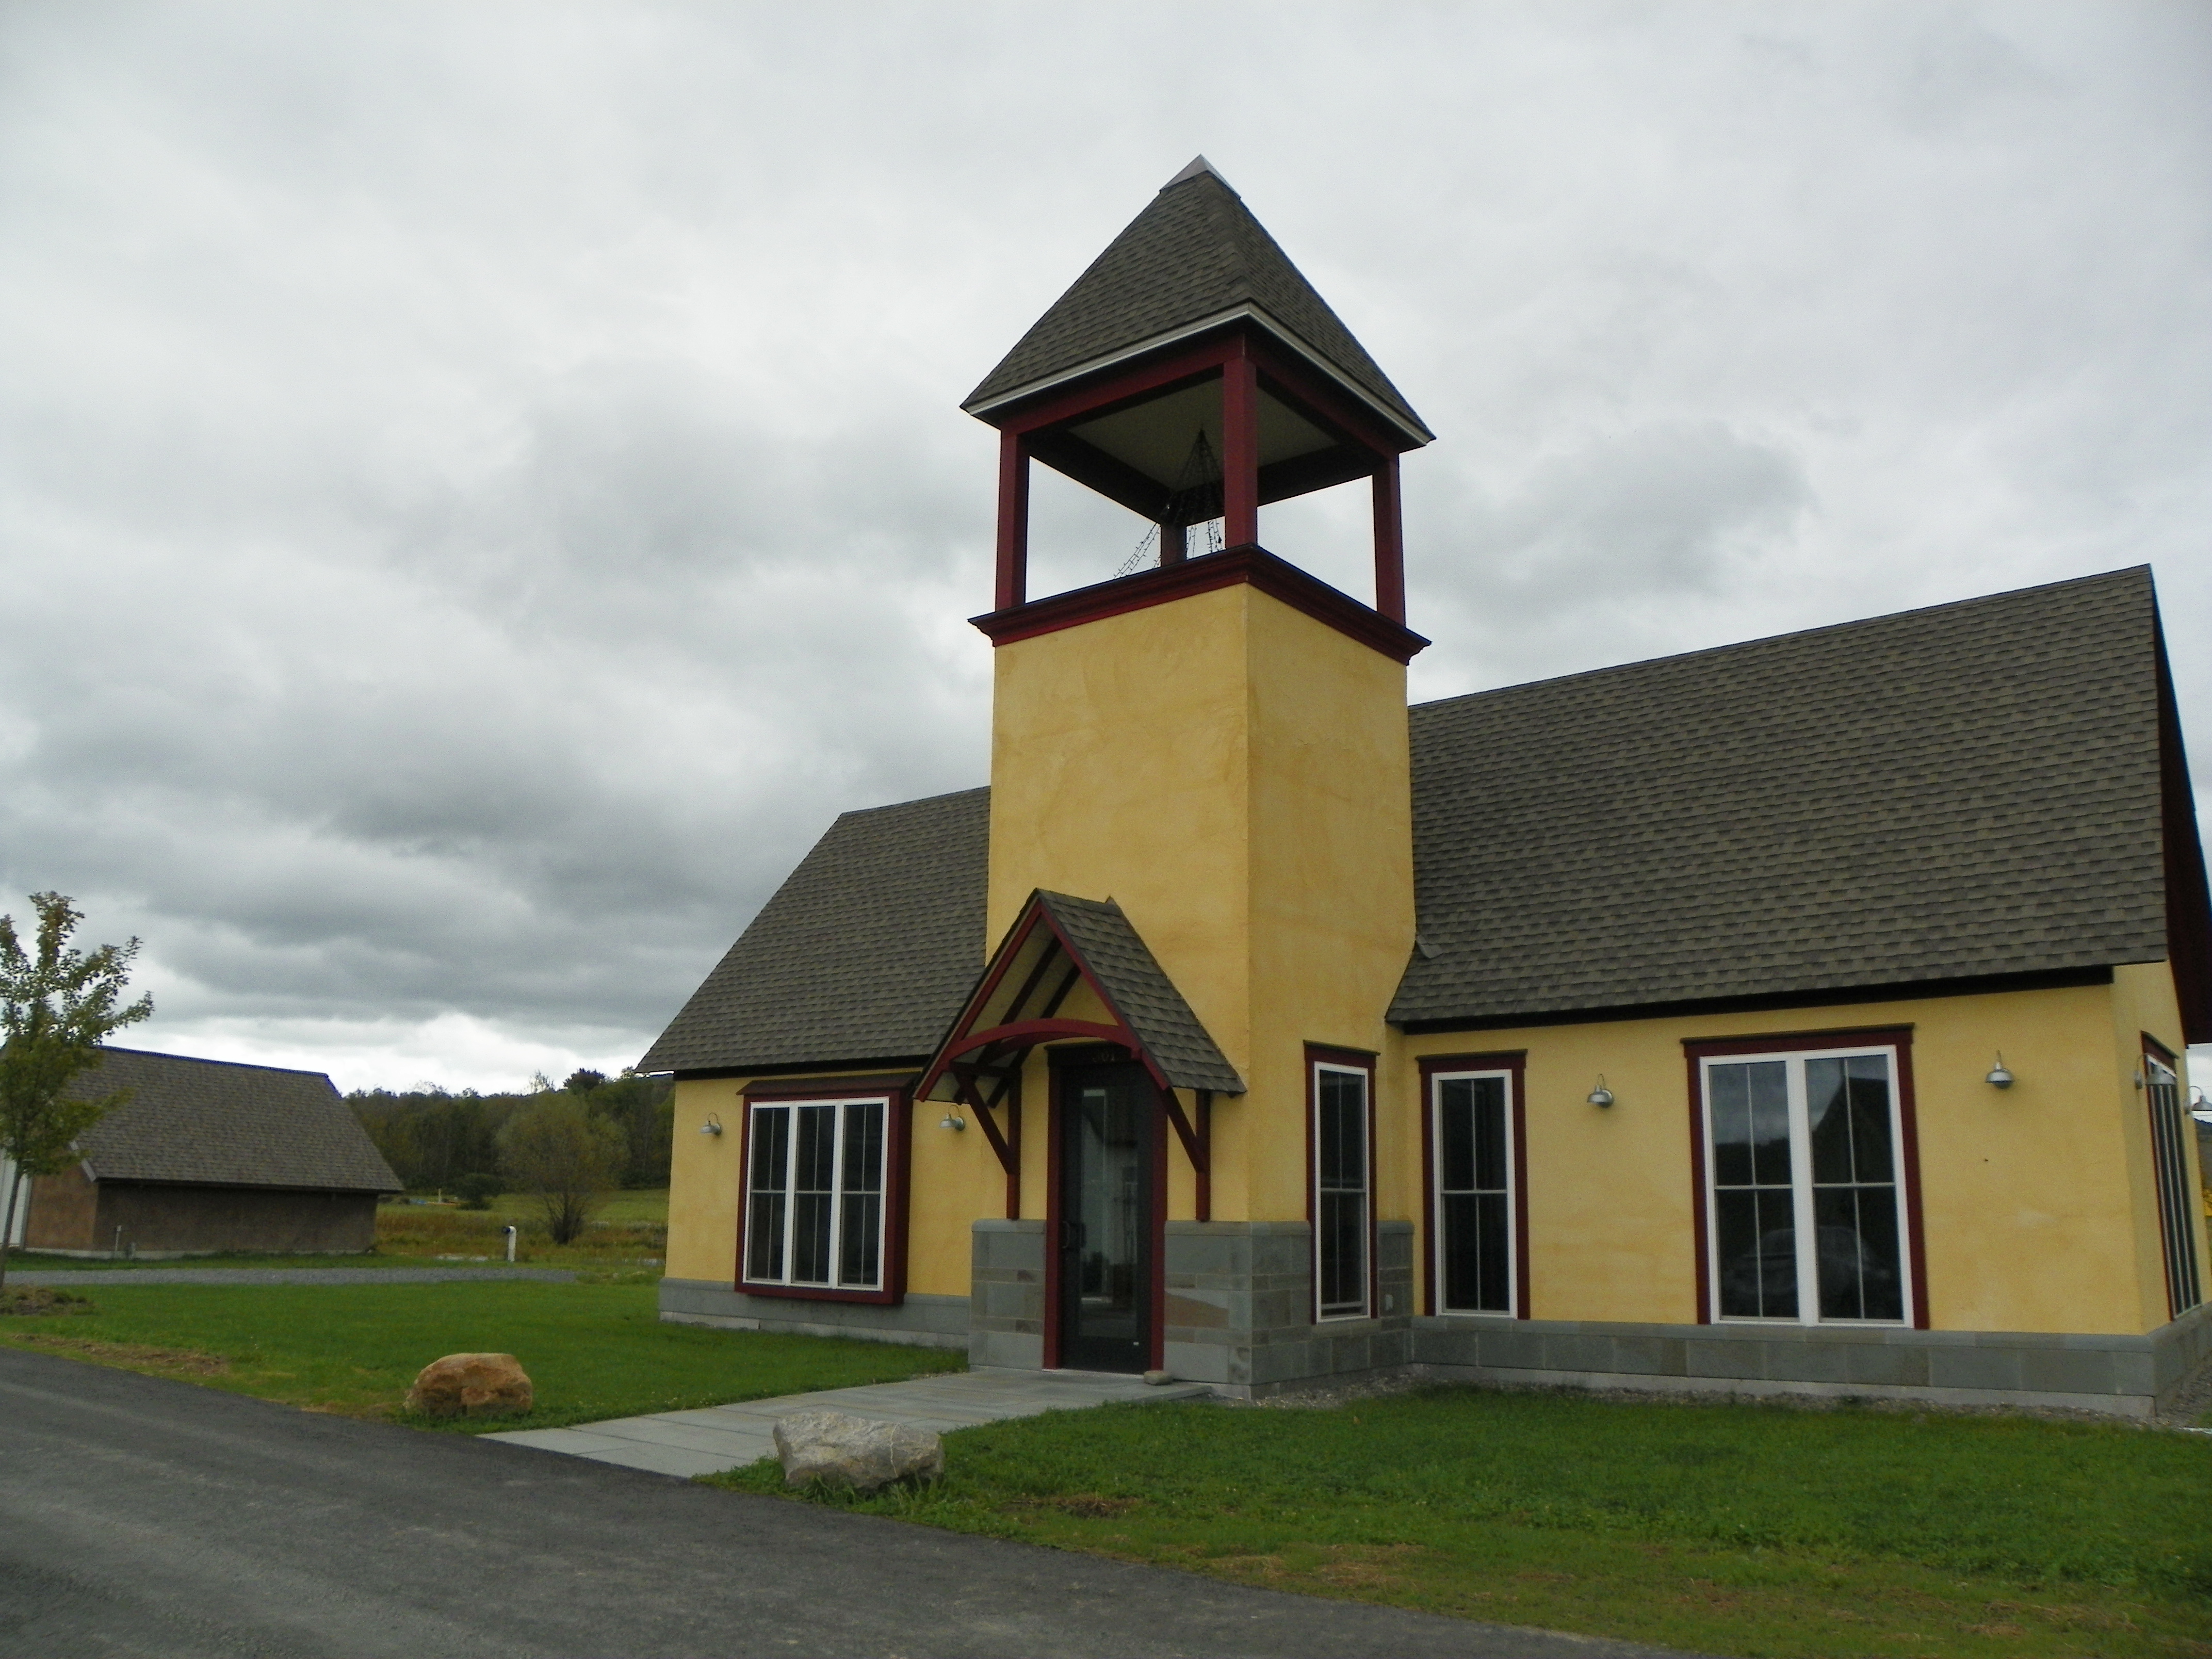
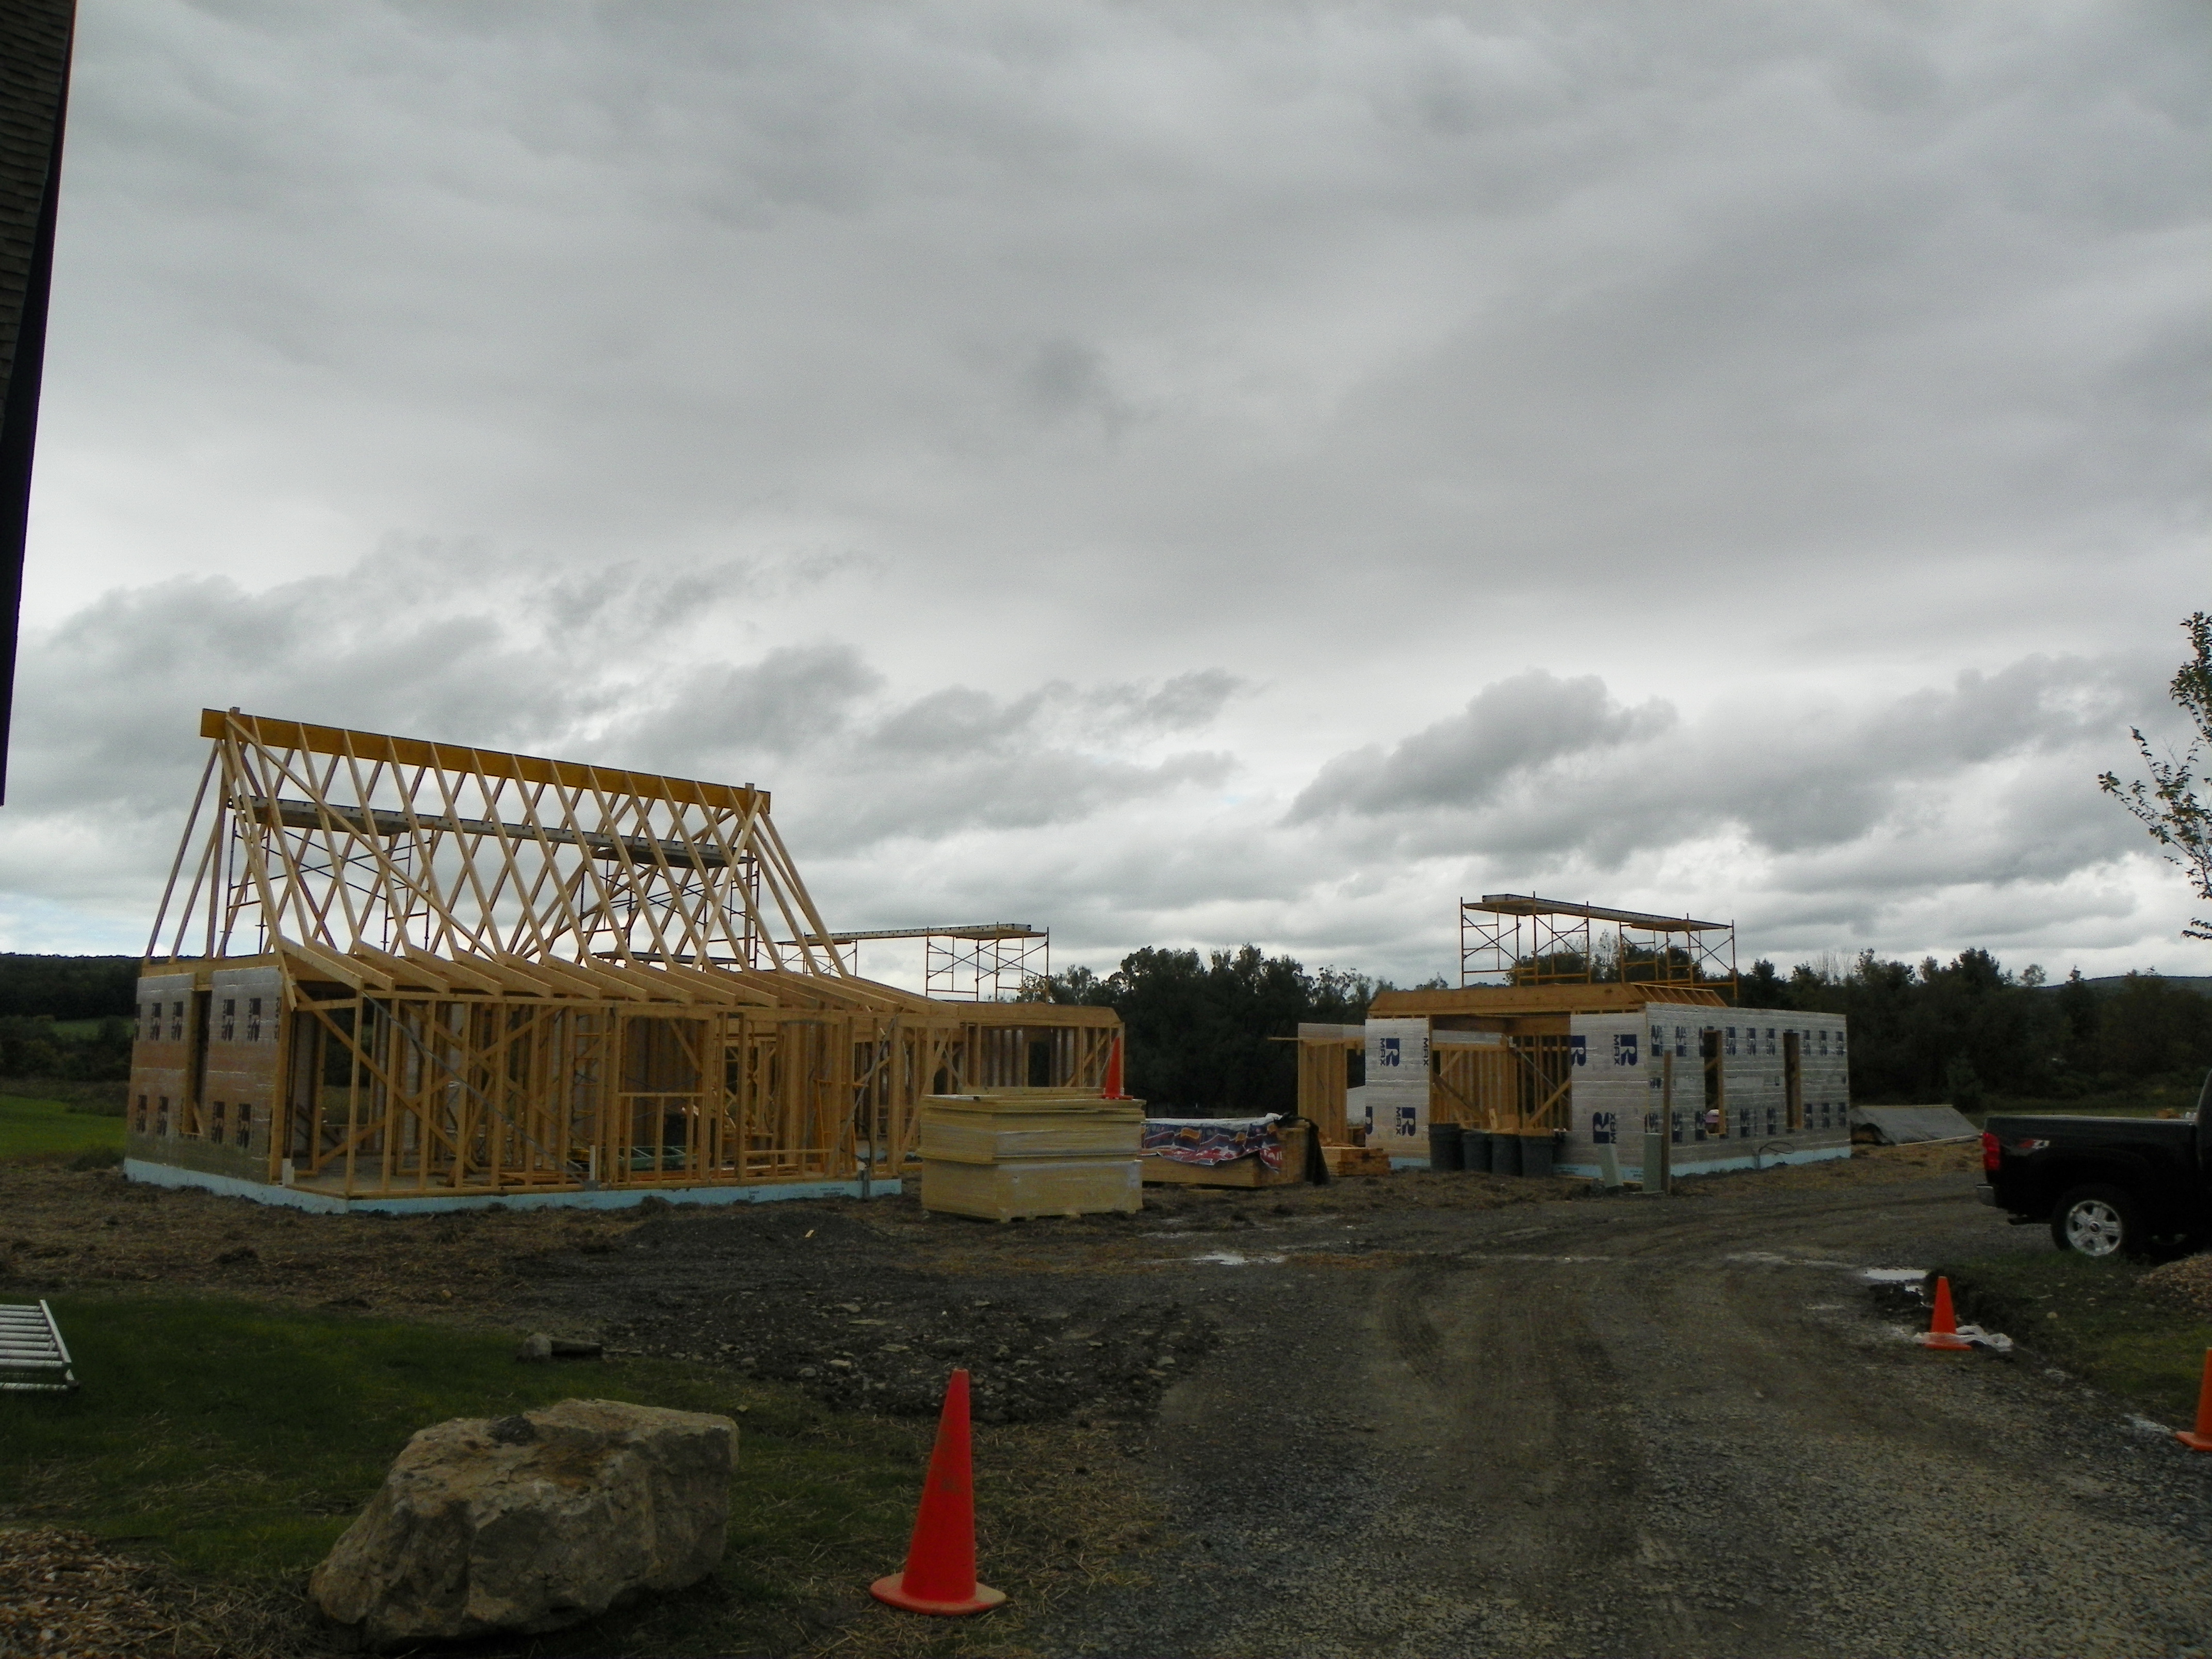
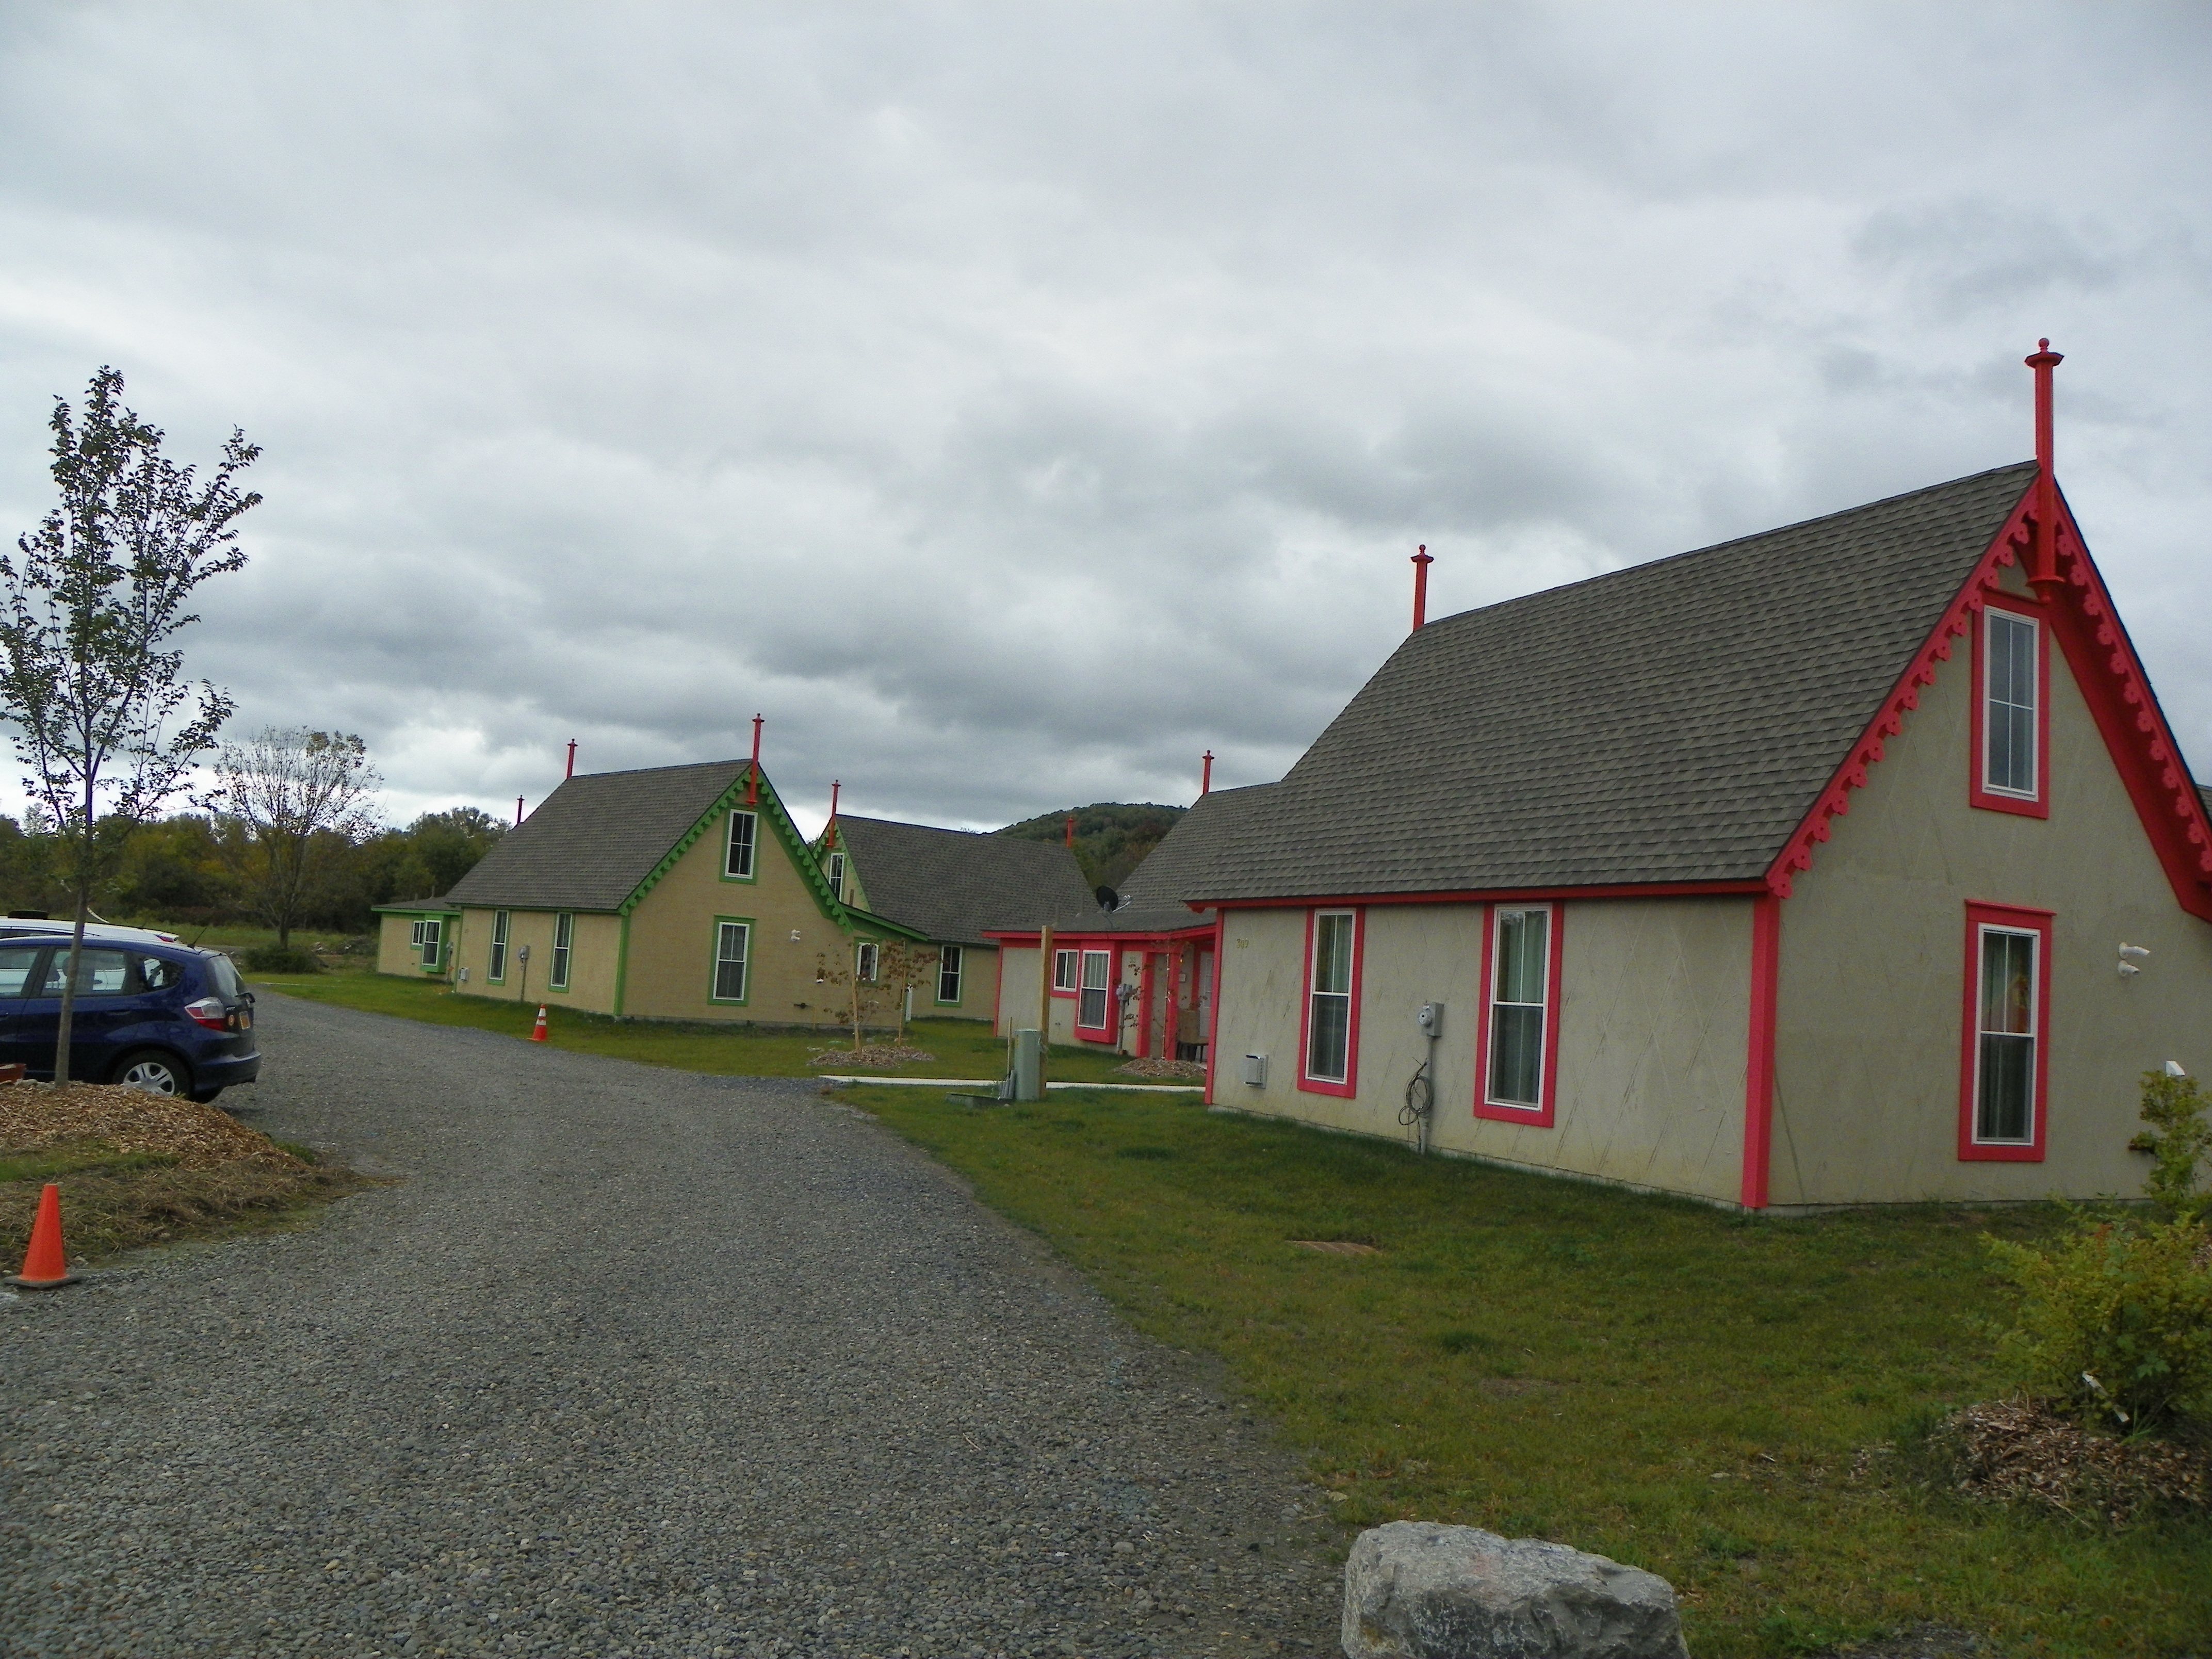
But, on my way out of town on 79, I did take photos of the Boiceville Cottages, since they’re outside of Ithaca Builds‘s usual haunts. Comparing to my April photos, Looks like they’ll have built at least 15 units this year.

9-24-2013 095 9-24-2013 096 9-24-2013 097 9-24-2013 098


Fast Facts: Cornell Enrollment Figures

20 09 2013

5-1-2012 140

Some insights via the University Factbook

– Cornell’s enrollment has grown markedly from 2002-2012, from 19,575 to 21,424 students.

totalstuenr

Which is not really the result of increases in undergrad transfers, which show no long-term trend (stays near 550, give or take a few percent).

transstuenr

Although UG enrollment has increased 3.9% over the decade (from 13,725 in 2002 to 14,261 in Fall 2012). In effect, undergrads aren’t the major growth component here.

UGstuenr

Haha, of course not. Undergrads often require aid. And the proportion of the student population receiving aid has increased over the decade, from 48 to 57 percent:

ugstuaid

Worth noting, the primary jump, from 2007 to 2009 (46.73% to 56,49%) ties in pretty well with the enactment of Cornell then-new financial aid policy, and the economic nosedive of the late 2000s.

The growth comes from our workhorses – the grad students, many of whom have stipends and tuition waivers in return for their TA/RA work:

gradstuenr

…and our cashcows, the professional students like those pursuing law degrees and MBAs, and paying out for those degrees (Fall 2013 values $57,270/yr and $55,948/yr respectively). Yes, I’m aware many business pay for their employees to get MBAs, but the point is, someone’s ponying up the cash.

profstuenr

Grad students increased from 4288 to 5049 over 10 years (+17.75%) and professional students from 1562 to 2114 (+35.34%).

In tying in to the other theme of this blog, all those grad students and professional students have to be housed somewhere, and only a very small number can find space on campus. There you go Ithaca real estate developers, there’s another positive factor in your growing market. Assuming the 2.0 figure for the average number of unrelated people sharing a unit. you get 925 units. West Campus added no new beds, so I’m pretty sure the on-campus resident population from 2002-2012 was nearly static.


Cornell Drops a Spot and the World is Ending

10 09 2013

USN&WR drops Cornell from 15th to 16th and the entire Cornell-centric world becomes unglued.

“If we don’t get back to top 12 soon, I’m rescinding my diploma.”

“it was 12 like my sophomore year with Columbia at 10.
now it’s 16 and Columbia is at 4. Yay for Skorton!”

Not even in top 15.. Cornell is dilutinge ivy league brand.. Should apologize to rest of ivys…

Quick Trudy, grab the smelling salts, I fear a mass fainting spell is a-comin’.

Ignoring the fact that rankings are becoming a dime a dozen, and that USN&WR tweaked its ranking system, I’m going to focus on the historical standpoint of rankings. First off, a brief check of previous rankings of Cornell by USN&WR. As noted by the Chronicle, Cornell’s US News ranking generally fluctuated between 10th and 14th from 1989-2009. More specifically:

2014: 16th

2010, 2011, 2012, 2013: 15th

2009: 14th

2008: 13th

2007: 12th

2006: 13th

2002, 2003, 2004, 2005: 14th

2001: 10th

2000: 11th

1999: 6th

1998, 1997: 14th

1996: 13th

1995: 15th

1994: 10th

1993: 11th

1992: 12th

1991: 9th

1990: 11th

1989: 14th

1988: 11th

1983: 8th

Let me offer a visualization:

cu_usnwr

Cornell has only briefly flirted with rankings of 12th or higher in the past two decades. I’m going to go out on a limb here and say that in general, it’s less what Cornell is doing and the changes have more to do with the way the rankings are calculated. Noting the above commenters, and that Columbia was last ranked 10th in 2003, it’s essentially a group of knee-jerk reactions from not-so-young alumni.  With regards to the previous entry, we’ve seen that US News’s ranking has little bearing on the acceptance rates, application numbers, and applicant yields. I understand the prestige factor and concerns if this worsens, but unless your job is extraordinarily dependent on your alma mater’s current ranking by a single agency, I suggest toning down the hysterics.

It’s the same damn thing every time. Ranking drops, people from that school are up in arms, the school is decaying, students are worse these days, its the admin’s fault, don’t associate with me with that lowly school. Ranking goes up, people call it “the new/public/Southern/Western Ivy/Harvard/insert prestige item here” and croon about how smart they are, even if they went there twenty years ago when its rankings were lower.

It’s good to assess the school’s direction periodically, but with every annual reranking, some alums need a reality check more than anything else.


Fast Facts – Cornell Admissions

5 09 2013

7-26-2013 039

Well if this isn’t just one of the best one-stop shopping sites for Cornell facts. Five years ago, when this blog started, the “University Factbook” would best be described as a bunch of sparsely-populated webpages and a ramshackle set of links between them, more of an amateur endeavor than anything specific produced by the university. This is quite much awesome.

Since I feed off of Cornell/Cornelliana facts much like an addict looking for their next hit, I thought it was fascinating to consider enrollment trends and things of those numbers in context. Since the graphs start at 1980, I’ll start from there as well. Note that these figures cover undergraduate admissions only.

  • Looking at the number of applications and starting with the 17,007 in 1980, there’s a steady rise through most the 1980s, peaking in fall 1988 with 21,765 applications. From there, the numbers drop off to about 20,000 and stay close to that value until the fall of 2004, where a rapid ascension commences. Much of this can be explained by Cornell starting to accept the Common Application, where a check of the box equals another base application, making it much easier for the prospect to apply to 20 schools instead of a few.  Arts and Sciences and CALS follow the same general trend, while engineers never had much of a peak in the 80s, and AAP applications have dropped off since 2010. HumEc has stayed roughly constant since the late 1980s, the Hotel school shows the most wild swings, and ILR really took off in 2006, when some folks decided that being a lawyer was the path to easy riches. We also have the ones that don’t choose a school, which if I remember right, means an automatic rejection. Cornell shows at least 1,000 a year since 2006, and over 2,000 in 2008. Nice one, kids.
  • Looking at acceptances, Cornell started the ’80s with around 5500 acceptances per cycle, creeping past 6,000 as the decade progressed. For some reason, the numbers shot up in the 1990s to over 7,000 acceptances by 1993, and stayed near that number through 1998. After that, Cornell became more stringent, and acceptances dropped to 5,861 by 2001. Numbers have stayed in the 6,000 range since, with mini-peaks in the fall 2006 and 2008 classes, and little dips in the early 2000s and with the most recent classes.
  • The largest freshman classes? 2011, with 3356, followed by 1993(3286) and 2013(3282). The lows were all in the early 1980s, led by 1982(2785), and followed by 1980(2836) and 1981(2885). Cornell’s capacity has grown over the years, as the north campus townhouses were built in 1989, and CKB/Mews were opened in 2001. Notably, the last sub-3,000 class, in 1992(2959), seems to have precipitated the 1993 peak. No schools show any discernible trends, although Engineering’s numbers were up during the days of the 1990s tech boom.
  • The highest yields for the university (average 49.2%) were in 1984, 2000, 2001, and post-2010 (2013 is the highest at 53.4%). The lowest yields were 1992-97 and the mid 2000s. 1992 was the lowest at 44.4%. The university will have its work cut out for it as the echo boomers/millennials finish their collegiate years and schools compete over what may be smaller applicant pools.
  • HumEc shows the widest range in yield, with a low of 48% in 1983 to a high of 96% with the fall 2001 frosh class (the latest class is 67%). Schools with specialized focuses, like ILR and Hotel, seem to have the best yields, as Hotel pulls numbers consistently near 90%, and ILR does as well (albeit a little more inconsistently). CALS also pulls above average numbers, which may be in part to the in-state tuition benefit. Engineers are close to the university average (damn you MIT), while Arts has an average yield only in the upper 30s (there’s just so many liberal arts schools to compete with, not to mention the other Ivies…)
  • On average, women have a slightly higher yield than men, 49.9% vs. 48.4%. A few years, such as 2008, had a higher yield for men than women.