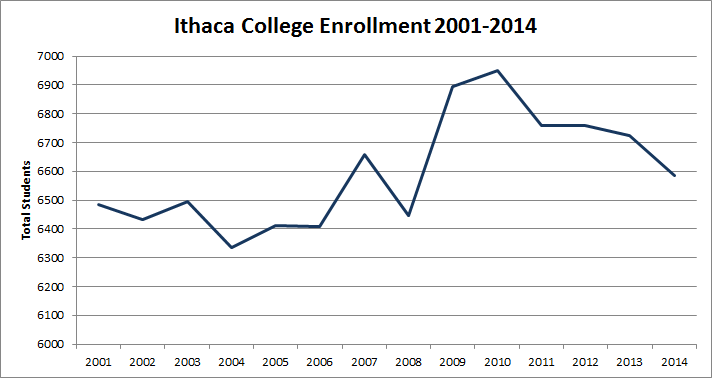
All facts come from Ithaca College’s Office of Institutional Research. All enrollment values are for the fall semester of a given year, i.e. 2001 means fall 2001.
Since the blog has previously taken a look at Cornell’s faculty and staff headcounts, it seems only fair to take a look at Ithaca College’s as well.

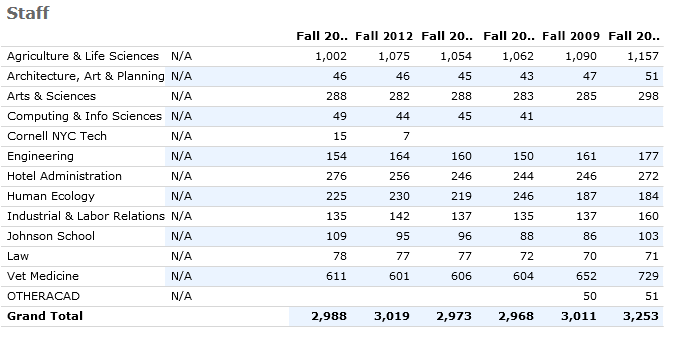
Over the past decade or so, Ithaca College’s employment has grown. Since 2002, headcount has increased by 302 people/20.1%, about 1.68% per year on average. During the recession, employment at the school actually increased at a faster pace than the average, a stark contrast to the hundreds of jobs that were cut at Cornell.

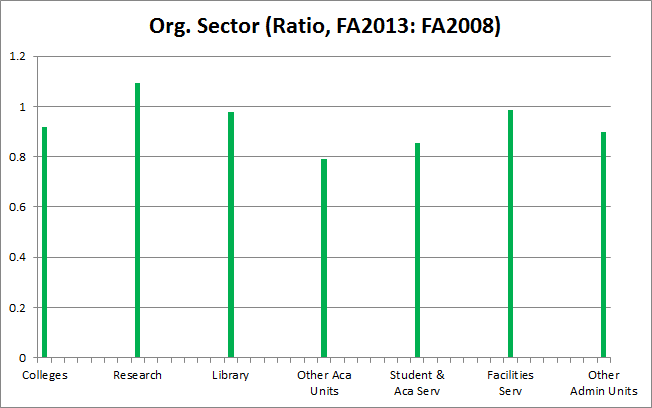
Breaking the numbers down into faculty and admin/staff components, faculty employment has grown by 155/26.96% since 2002, somewhat faster than the 147 person/15.86% growth in staff employment.
For the sake of comparison, Cornell employed 7,075 non-academic staff in 2002 and 7,018 in 2014, a 57 person/0.8% decrease. The Big Red also employed 2,756 faculty/academic staff in 2002, and 2,763 profs and lecturers in 2014, a 7 person/0.3% increase. (note, Cornell numbers are for the Ithaca campus only).
In other words, we have over the past decade or so, one school that has seen only small enrollment growth but large employment growth, while the other has seen large enrollment growth and no employment growth. I can’t vouch for whether one school’s grasp of their situation is better than the other, but the differences between the two make for an engaging conversation piece.
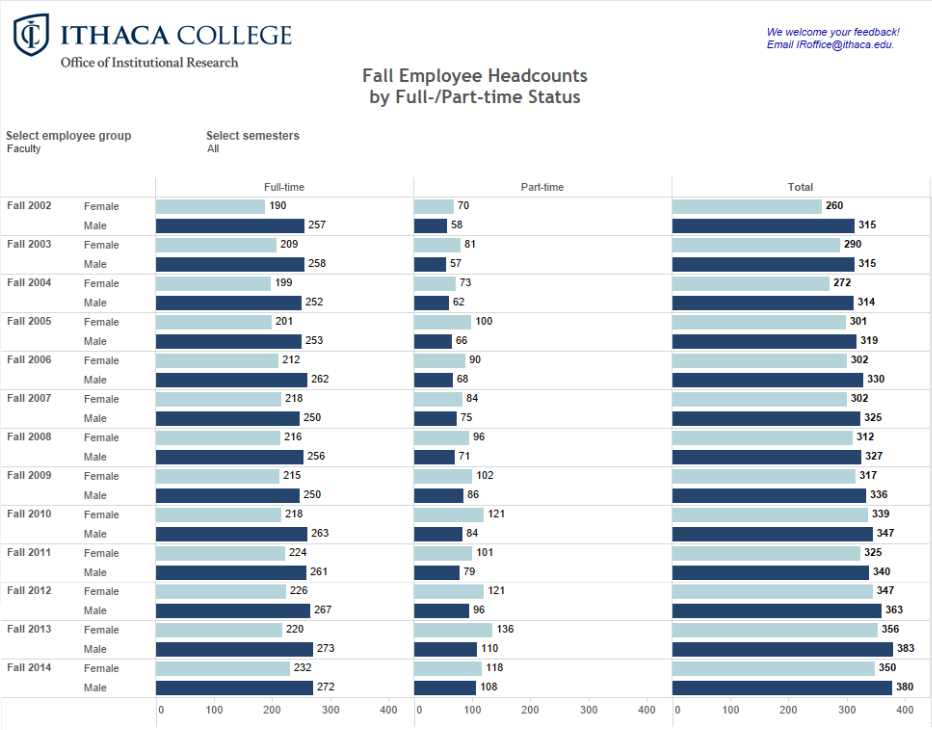
Here’s something more apropos to current events – the split between full-time and part-time faculty at IC. In 2002, 18.41% of male faculty and 26.92% of female faculty were part-time. In 2014, 28.42% of male faculty and 33.71% of female faculty were part-time. Although Ithaca College has added 155 faculty over 12 years, only 57 of those positions are full-time. Part of the the growth in part-time faculty can be attributed to the growth in graduate students, who are considered part-time faculty at IC if they are teaching. But regardless, it’s clear that Ithaca has become more reliant on part-time staff to meet its teaching needs.
Not to take an official stance on any union-organizing, but double-checking with some previous Voice write-ups, the graph above means that there were 226 Ithaca College faculty that were earning no more than about $16,000/year.
Cornell doesn’t have part-time faculty listed in their data, but I assume grad students with TA assignments fill that role. As of 2014, 6.6% of non-academic staff at Cornell (468 of 7047) are considered part time, while 25% of non-academic IC staff (268 of 1074) are part time. So maybe that’s another piece in the conversation comparing schools.