To go with your Thanksgiving meals, here’s some food for thought, courtesy of the university factbook.
Tuition goes up in fits and starts. Consider the graph for the endowed colleges shown below.
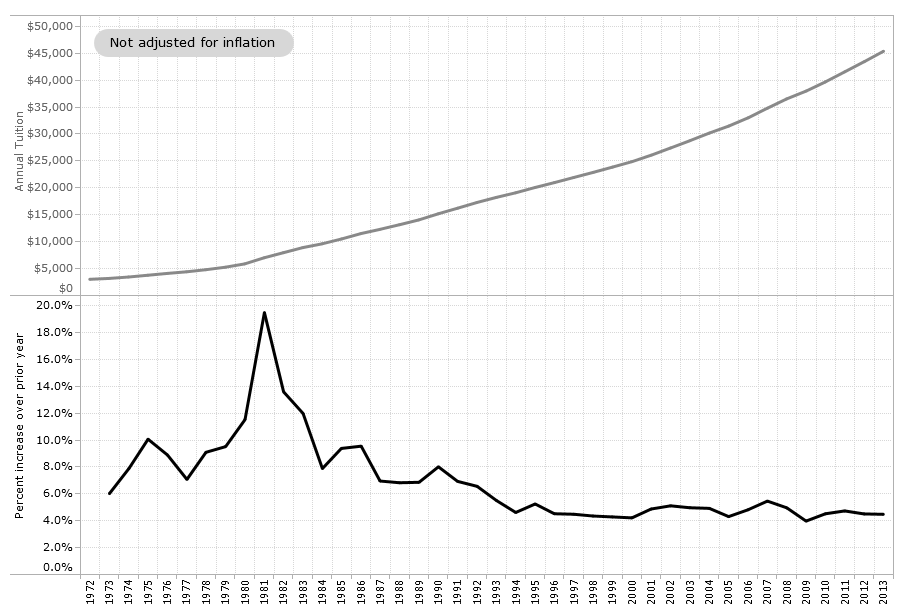
In 1973, tuition and fees added up to about $3,180, a 6% increase over the previous year. According to the inflation calculator from the Bureau of Labor Statistics, this is equivalent to about $16,727 dollars today. Put into further perspective, that was about the same price as a brand-new Chevy Chevelle Laguna Colonnade sedan. You know it’s a great car when it has that many names. Median household income was $9,226, so tuition was about 34.5% of the mean household’s annual income.
If the annual tuition hikes seem a bit high in the 1970s and early 1980s, it’s for good reason – this was a period known for stagflation, where the economy grew at anemic rates (if it all), while inflation continued to rise near 10% yearly. Fall 1981 was particularly shocking, with a 19.5% increase in tuition and fees over the previous academic year, from $5,860 to $7,000. Still, compared to today, that BLS calculator says $7,000 in 1981 has about as much buying power as $17,985 dollars today. Put another way, that was about 36.7% of annual household income in 1981 ($19,074). Or to illustrate the advances in computers, a top of the line IBM 5150 PC cost about $6k, with color graphics and a 256kb hard drive.
Since 1983, there have been no annual increases greater than 10%. By 1993, tuition and fees went up a relatively modest 5.5% to $18,226. With the exception of the 5.5% increase in Fall 2007, all other years in the two decades since have been less than 5.5%, falling somewhere between 4% and the low 5’s. Fall 2009 is the lowest at 4%, likely an effect of the Great Recession. Inflation-adjusted, tuition cost about $29,458 in 2013 dollars. Keeping with the theme, household income was $30,210 in 1993, or about 60.33% of annual household income. So through the 80s and early 90s, we’re starting to see this rapid relative rise in tuition vs. income, even though the annual increases have dropped off as inflation lessened.
Fast forward ten more years to 2003. The mean household annual income was $42,560. Knowing my own family’s finances, we were about a little below that average. Tuition in 2003 had increased 5% over the previous year to $28,754, or 67.6% of mean household annual income. Or to a working-class family like mine, it meant being told at a young age that if you didn’t get scholarships, you weren’t going to college.
The most recent estimate for mean household annual income is about $51,017. Tuition at an endowed college is $45,358 this year, a 4.5% increase over 2012. 88.9% of the mean household’s income in a year. There’s a reason why college debt gets so much attention these days.
For the purpose of being all-encompassing, in-state tuition for the contract colleges, followed by non-resident tuition at those schools, is included below:

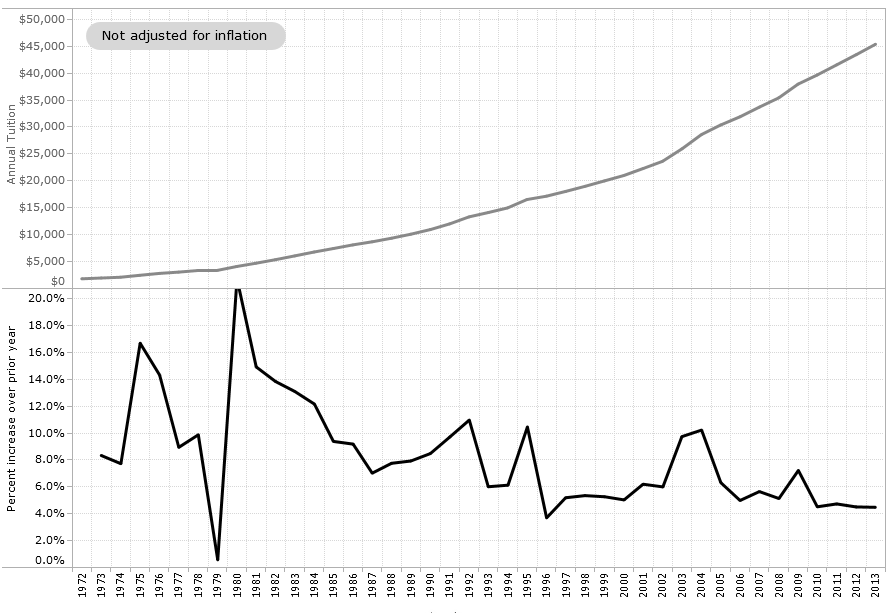
Year Tuition (NYS/non-res) nys:non-res MHAI Tuition as % of MHAI
1973 $1,350/2,100 0.642 $9,226 14.6%/22.8%
1981 $2,800/4,700 0.596 $19,074 14.7%/24.6%
1993 $7,426/14,106 0.526 $30,210 24.6%/46.7%
2003 $14,624/25,924 0.564 $42,560 34.4%/60.9%
2013 $29,218/45,358 0.644 $51,017 57.3%/88.9%
Note that 1981 is a little misleading, as in-state tuition was jacked up $500 dollars for Fall 1982. Everything moves slower in state government. Except the tuition hikes themselves, those seem to be increasing at a pretty good clip.
Now, all of this information sounds pretty scary, and sticker shock certainly is. But the mean household income would get a full ride to Cornell on grants and scholarships. I was fortunate enough that Cornell’s revised program kicked in before my junior year, and even before that, my contributions were very modest. My debt load is small enough that it will be paid off by next spring. Cornell enabled a working class kid like me to go to a top college. For that I am thankful. Have a Happy Thanksgiving.

Leave a comment