Part I provided a brief examination of how the 1990s recession had a deep and lasting impact on the Ithaca economy, while the late 2000s recession was a minor hiccup in comparison. Here in Part II, those recessions will be looked at in greater detail by examining the different occupational groups that make up the Ithaca economy.
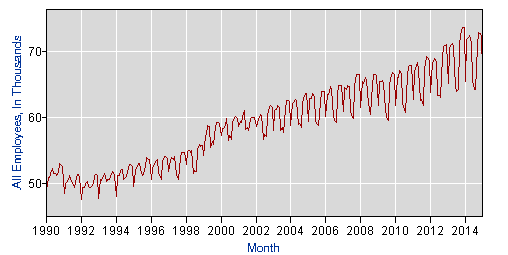
To see how the overall market changed, here is the plot of all the non-farm job sectors calculated, combined and tracked by the Federal Bureau of Labor Statistics (BLS) from 1990 to 2015. 1990 gives a nice 25-year figure, and it’s also as far as the online data goes back.
There are ten economic sectors defined by the BLS, and all counts are rounded to the nearest 100. Not all of them follow the same pattern as the overall numbers, as seen in the four sectors below.

Even with the substantial growth in the Ithaca economy, not all parts of the local economy reflect that. At top left is “Mining, Logging and Construction,” which in Ithaca is mostly construction and the Cargill salt mines in Lansing. Employment peaked at 1,700 in August 1990, fell during the economic doldrums of the 1990s, and has made a very gentle climb since the late 1990s, most likely due to population growth and the slow if steady rise in construction demand. Cornell’s recent budget problems could derail that rise.
At top right, “Manufacturing”, industrial makers and producers. Manufacturing peaked at 4,600 in October and November 2000. The woes in this sector match much of upstate – manufacturers closed or left the area for cheaper sites down south or overseas, like Ithaca Gun in 1986/87, NCR/Axiohm in the 1990s and Morse Chain in the late 2000s (Morse Chain shed 500 jobs in the late 2000s, which explains some of the plunge). Fortunately, companies like Borg Warner still maintain a strong presence, and there has been some growth lately thanks to firms such as Groton’s Plastisol and Ithaca’s Incodema.
Lower left is “Trade, Transportation and Utilities”. In this category is where truckers, warehouse workers, retailers, wholesalers and utility crews fall. This category peaked at 7,000 jobs twice, in January 2006 and January 2008, but has fallen closer to 6,000 jobs in the past year or so. The early 1990s dip is there, as is a dip during the late 2000s recession. Overall, the sector’s employment hasn’t changed a whole lot in the past 25 years.
Last image in the figure, at the lower right, is “Information“. Publishers, broadcasters, news agencies like the Ithaca Voice, telecommunications, movie makers, and so on. The category has never employed more than 800 people locally, and is at an all time low as of late (on a national level, the industry has shrunk by a third since the early 2000s). It doesn’t follow the recessions, but it’s a tiny portion of the Ithaca market anyway.
Okay, so these four either held steady or fell during both recessions, and are decreasing or holding steady while the overall local economy has grown. Let’s look at the next four:

The big difference between the first four and these four is that we can clearly see that these industries have grown in the past quarter century, some more than others.
“Financial Activities” at top left includes groups like bankers, insurance agents, and real estate agents. While currently at its highest ever, it’s hit that watermark many times in the past decade. The industries fell by similar amounts during both recessions, but the late 2000s down-period was much shorter.
The “Professional and Business Services” sector shown at top right includes engineers, architects, veterinarians, scientists and other technical professionals not associated with academia or government. They definitely saw a substantial drop during the ’90s recession, and it mimics that decade’s lengthy downturn. The late 2000s recession is barely noticeable, just like the overall jobs picture.
“Leisure and Hospitality” at lower left is easy enough to define – hoteliers, restaurants, and professional entertainers like musicians and artists. There’s been a big push in the hospitality subsector with new hotels in Ithaca opening recently and in the near future, but the job growth isn’t all too impressive, only a few hundred jobs during peak periods. Once again, this sector was deeply impacted by ’90s recession, and jostled though not seriously damaged by the 2000s recession.
The last category, “Other Services” on the lower right, is a catch-all. In this category the BLS includes mechanics, dry cleaners, nannies, social and environmental non-profits, clergy and lobbyists. Given this area’s strong social activism, there’s little reason to wonder why the jobs totals have steadily risen, even during the recessions.
These four probably played a role in Ithaca’s growth in the past 25 years – the city and county have transitioned from factory workers and tradesmen to engineers and non-profits. But I still have yet to touch on the two biggest categories, “Government” and “Education and Healthcare.” Those two, plus some ideas on why the 1990s downturn was worse than the late 2000s recession, will be presented in Part III.

Leave a comment