First off, the 2013 numbers have been revised from a yearly average of 69,000 to an average of 69,400, a 2.8% increase or 1,900 jobs more than the 2012 averaged job total of 67,500. The 2012 data were not changed.
Secondly, the 2014 total job numbers have also been revised upward, from an initial estimate of 69,150 jobs, to 69,650 in the Ithaca area in 2014. The gain seems paltry compared to 2013’s gains. 250 jobs, a 0.4% increase.
Looking at the data more closely, the 2014 data is, at a glance, alarming – November 2014 lost 1,000 jobs when compared to November 2013. December 2014 lost 1,500 jobs when compared to December 2013.
However, these results aren’t the result of changes in 2014. The Voice looked at archived reports of the initial jobs numbers for 2013 and 2014, which we’ve included below (values shown are in thousands – for example, 69.0 equals 69,000 jobs).
![]()
Now here are the revised 2013 numbers and 2014 numbers:
![]()
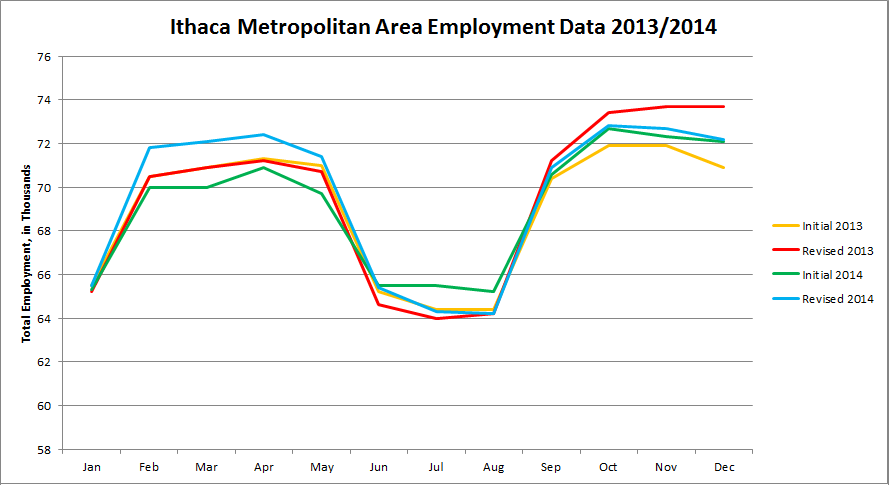

The large drop last Spring has been erased. The drop of 1300 jobs last May is now a gain of 700. Pretty big difference. Spring 2013 job numbers decreased slightly in the revision.Summer employment values were also decreased in both years, which means there is more seasonality to the Ithaca employment cycle than previously estimated.
So what can we expect from the 2014 numbers moving forward? Being the “freshest” data, there is a very good chance they will be revised again next March. For the sake of example, the 2013 numbers were initially 68,000 at the end of 2013, then 69,000 in the March 2014, and now 69,400. We will need to wait and see if the fall 2014 figures are adjusted, and by now much.

I still can’t see any of these graphs – the images are just “broken link” icons. Did you forget to upload them?
Uploaded to the wrong location. My mistake! It should be fixed now.